# glamr::setup_gitignore() # ignore certain file extensions
# glamr::setup_readme() # readme with a standard disclaimer
# glamr::folder_setup() # standardized set of folders

# All above functions are wrapped in another function
glamr::si_setup()

[1] "The following directories will be created:"
Data
Images
Scripts
AI
Dataout
Data_public
GIS
Documents
Graphics
markdown
✔ Setting active project to
'C:/Users/tessam/Documents/Github/demo_repo'
✔ Writing 'README.md'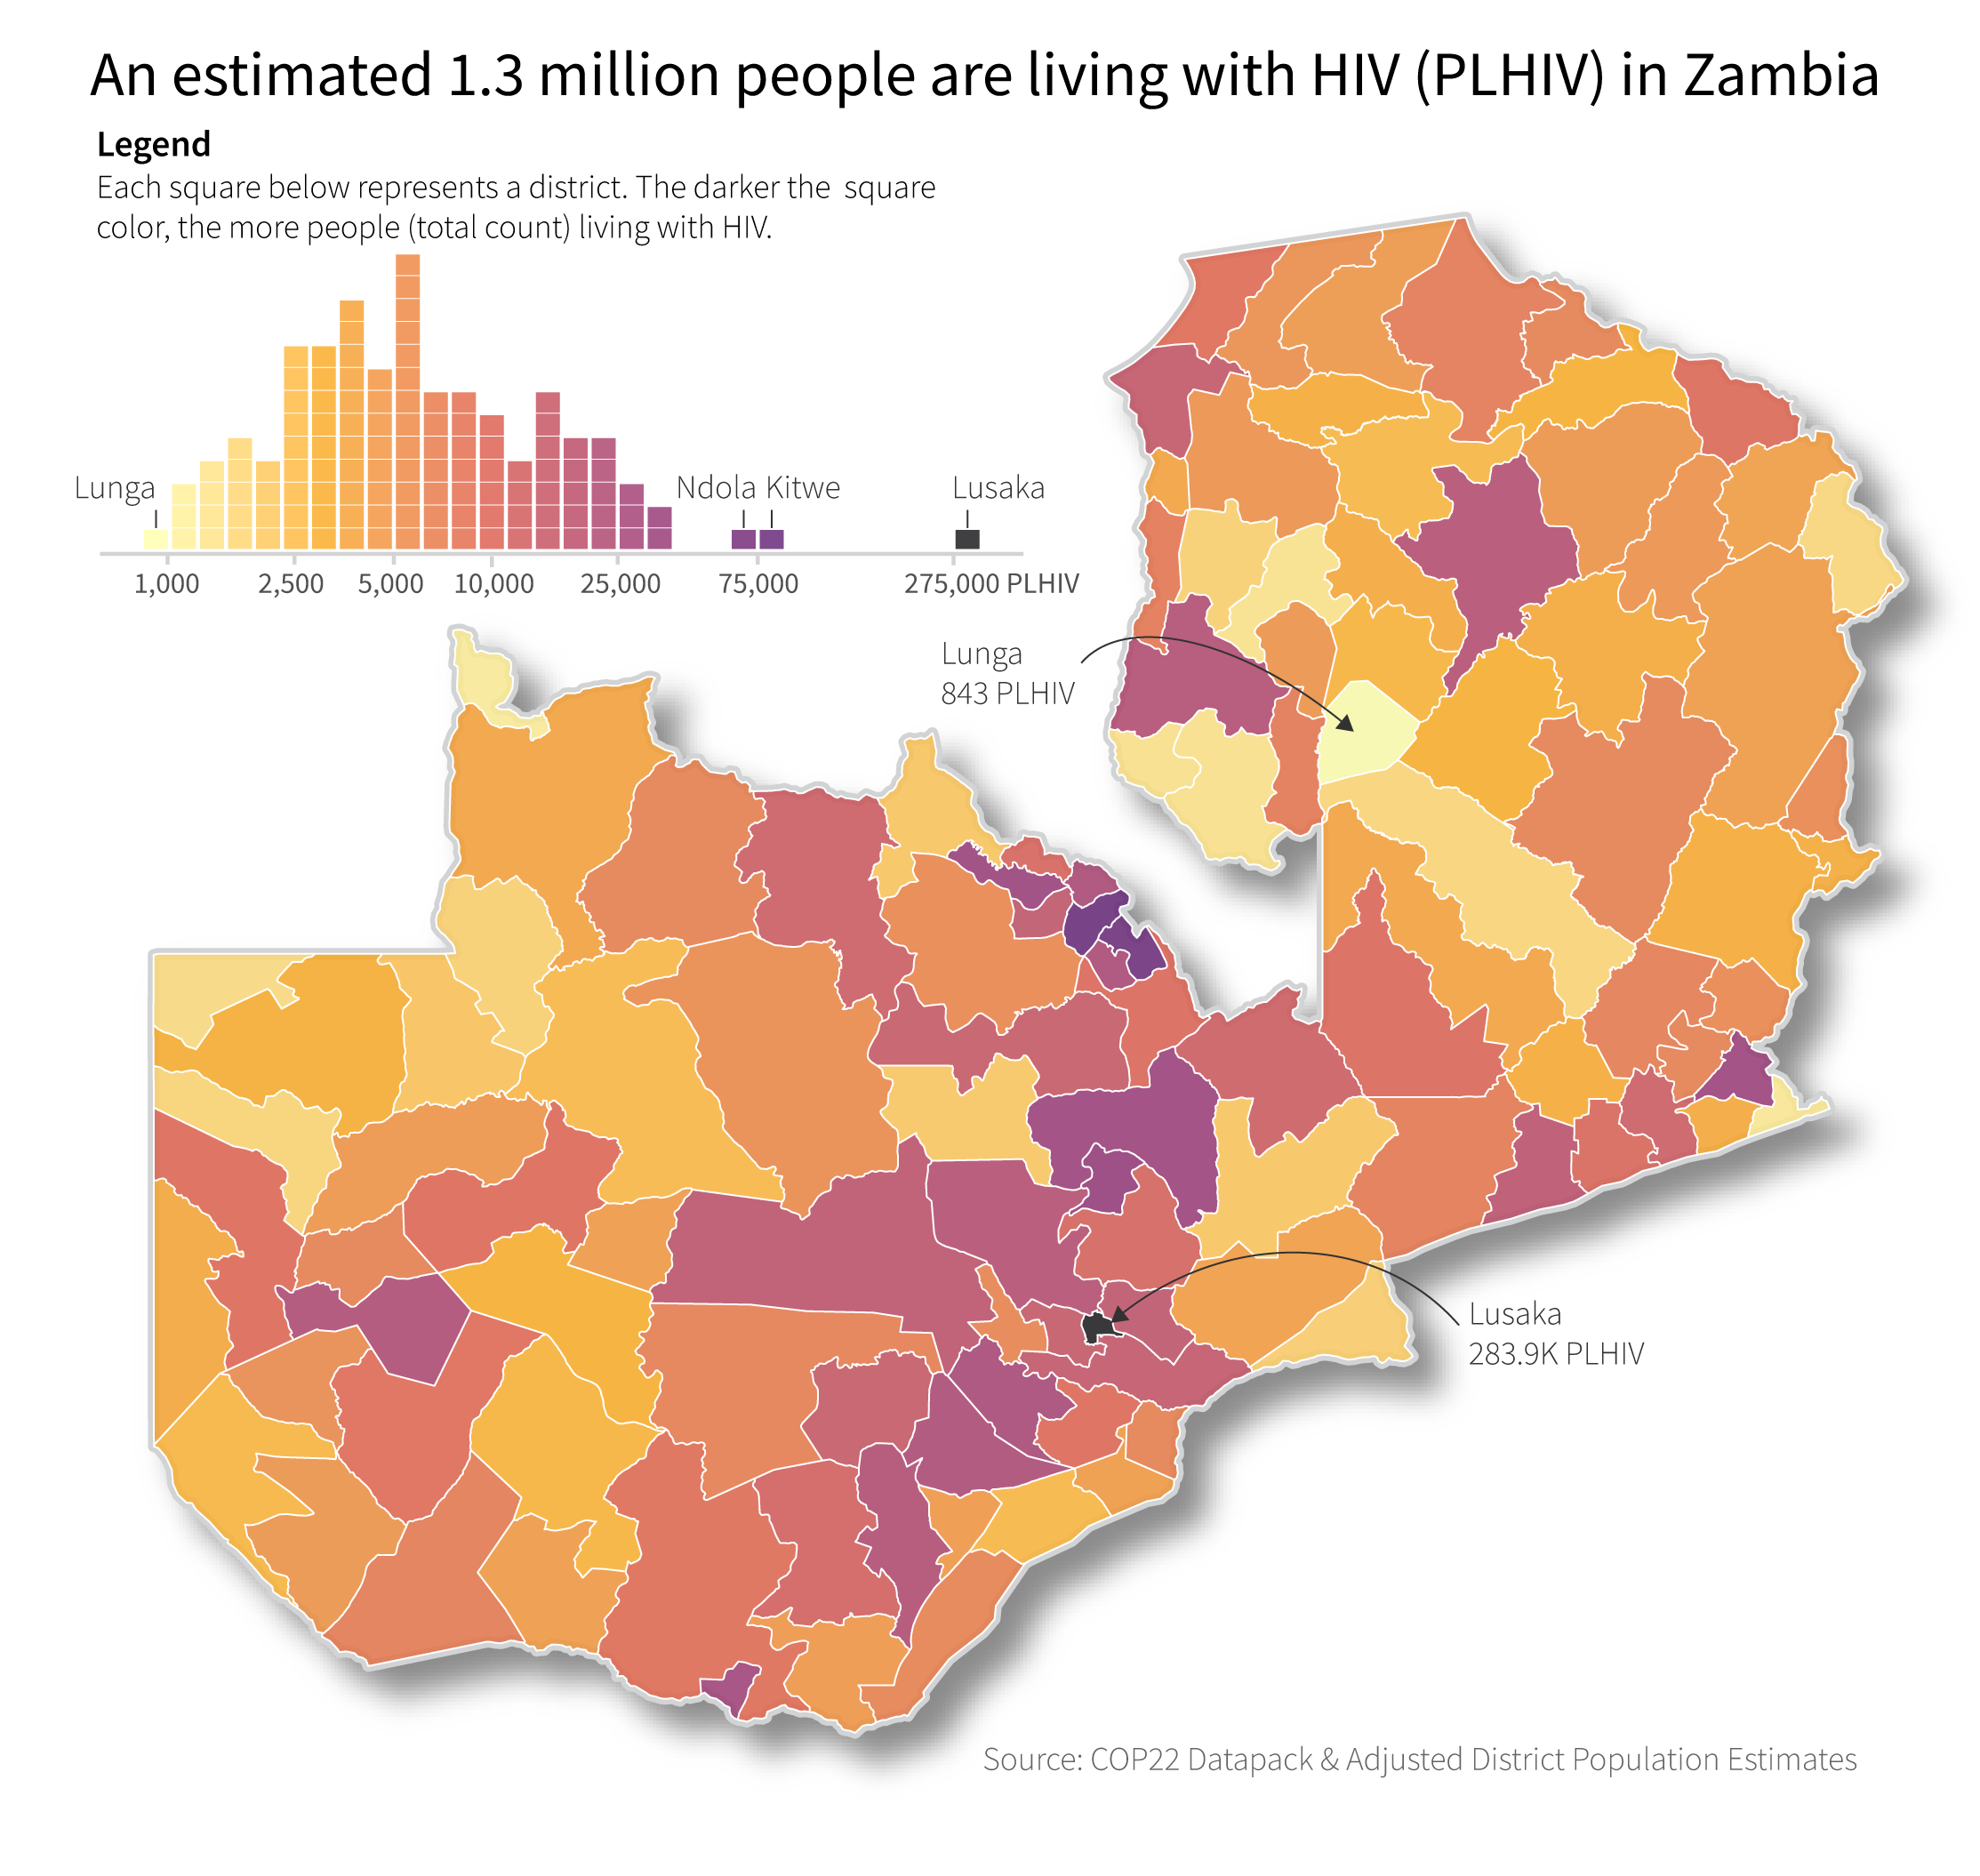
• Modify 'README.md'Digging a Pit of Success
Data Science Infrastructure in the Office of HIV/AIDS
4/19/23
Office of HIV/AIDS
Implement the U.S. President’s Emergency Plan for AIDS Relief (PEPFAR)
DATIM
DATIM (DHIS2) captures all PEPFAR’s monitoring, evaluation and reporting (MER) indicators.
Data intended for import into DATIM must satisfy strict requirements with respect to the format of the data as well the relationship of the data to the current metadata within of the system.
MER structured data sets are available through the platform.
![]()
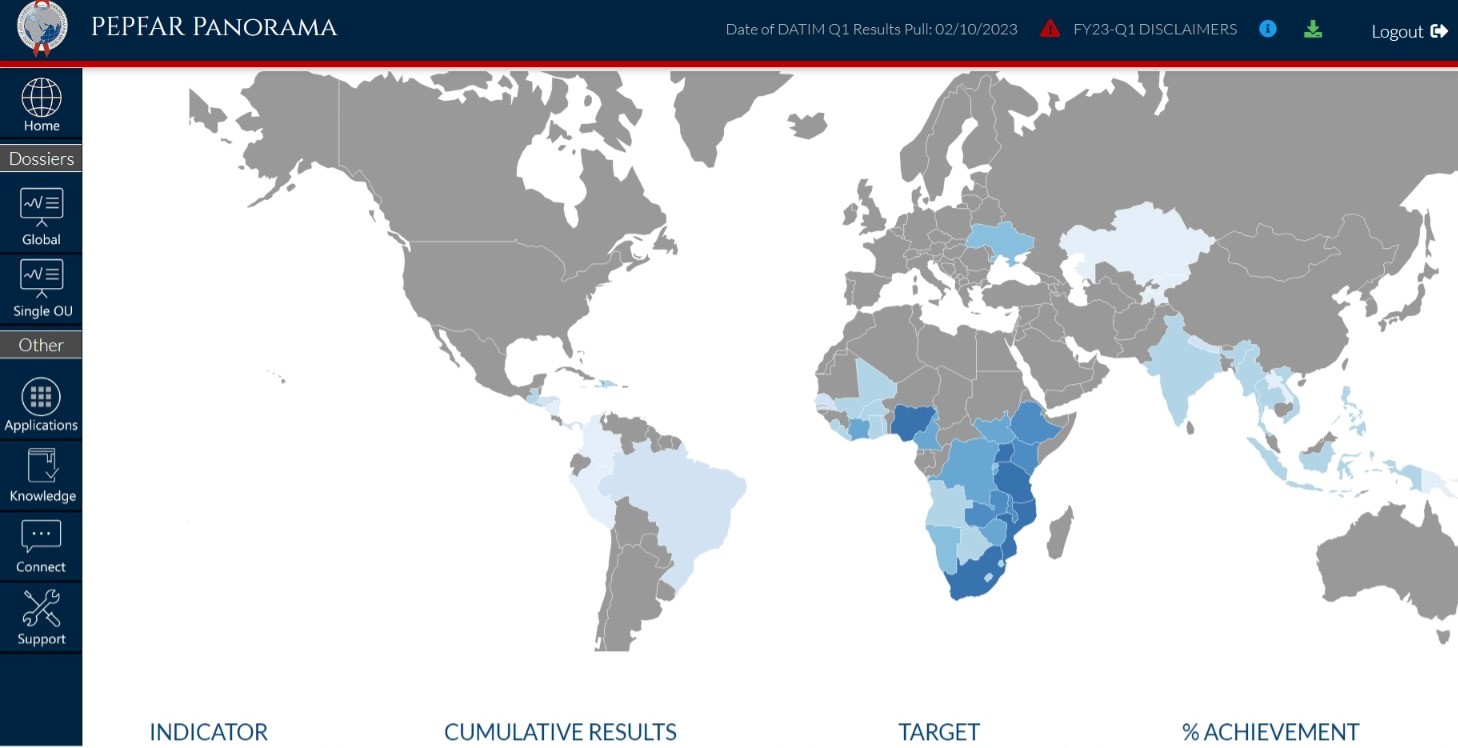
Panorama
Analytic platform built on top of DATIM that hosts dossiers, data tables, and custom applications built in MicroStrategy.
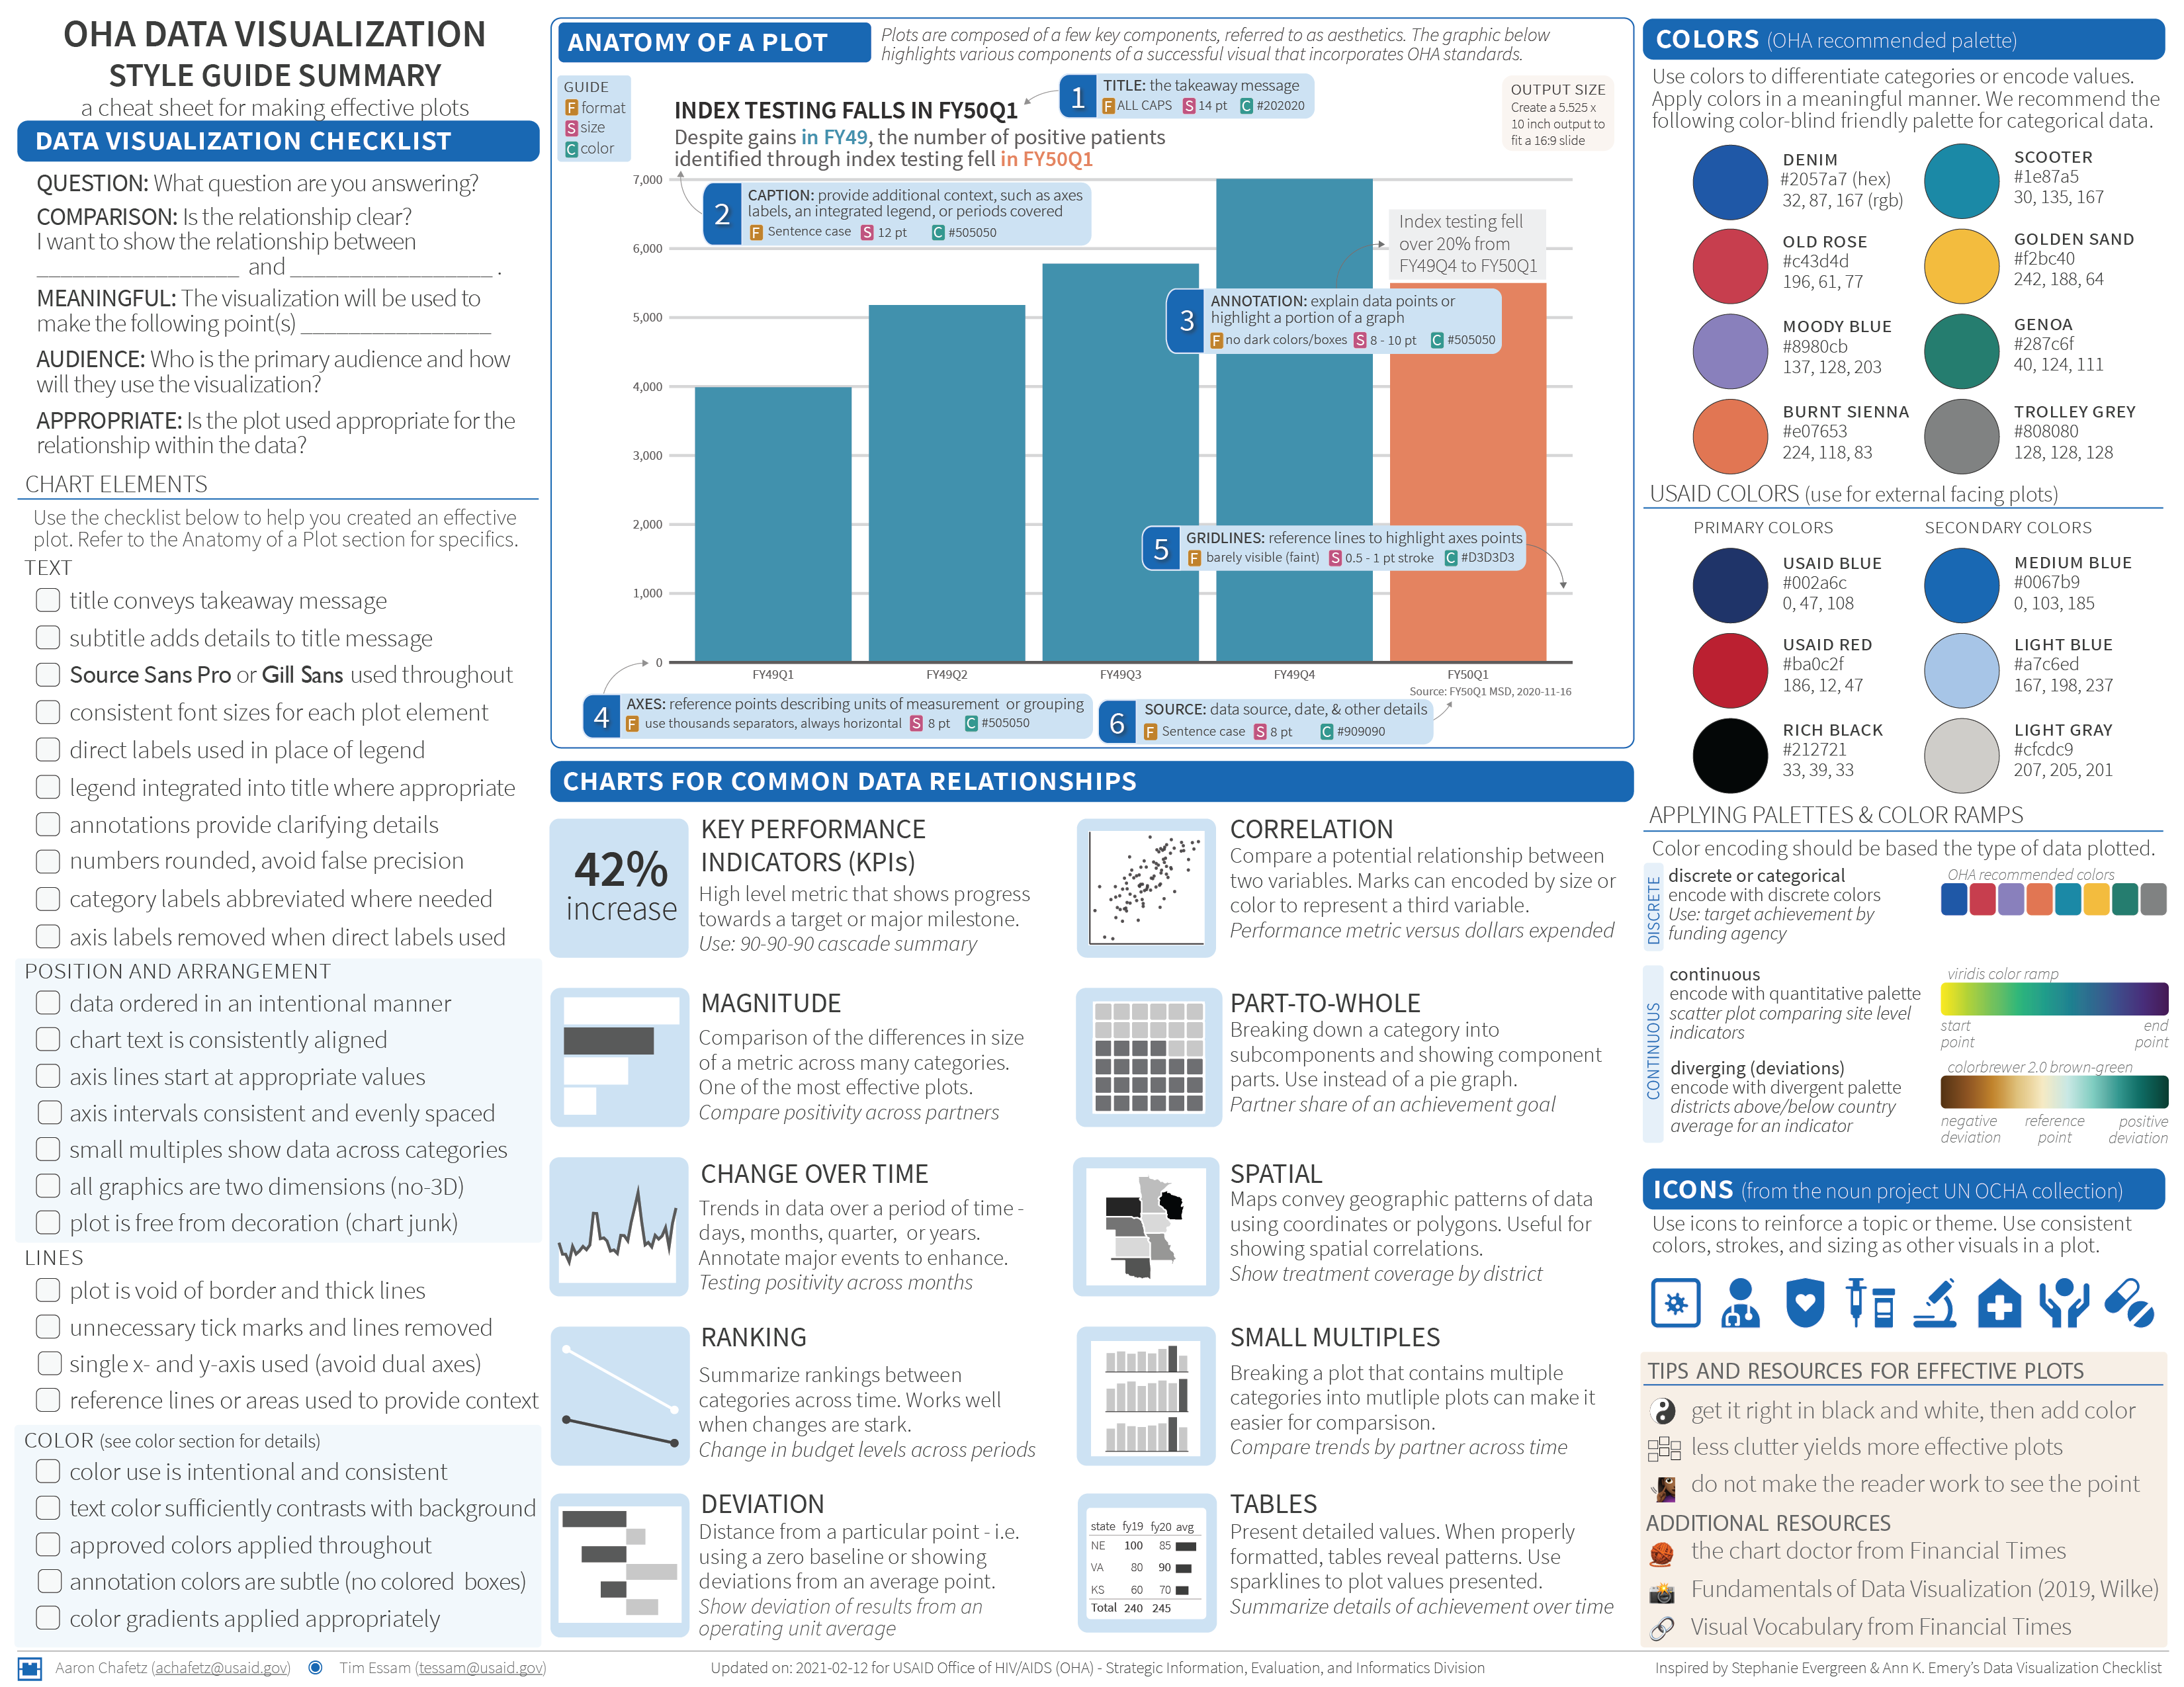
OHA Style Guide
Style guide serves as a tool to define and enhance brand cohesion. Where possible, we preset defaults (font, color, titles, captions) to save colleagues time and cognitive load.
Core Software
![]()
![]()
.svg/2203px-Microsoft_Office_Excel_(2019%E2%80%93present).svg.png)
![]()
![]()
![]()
R + RStudio
R + Rstudio is our primary analytic tool. Most of the SI infrastructure is based on tidyverse principles and workflows.
![]()
![]()
![]()
![]()
![]()
![]()
![]()
![]()
![]()
![]()
![]()
![]()
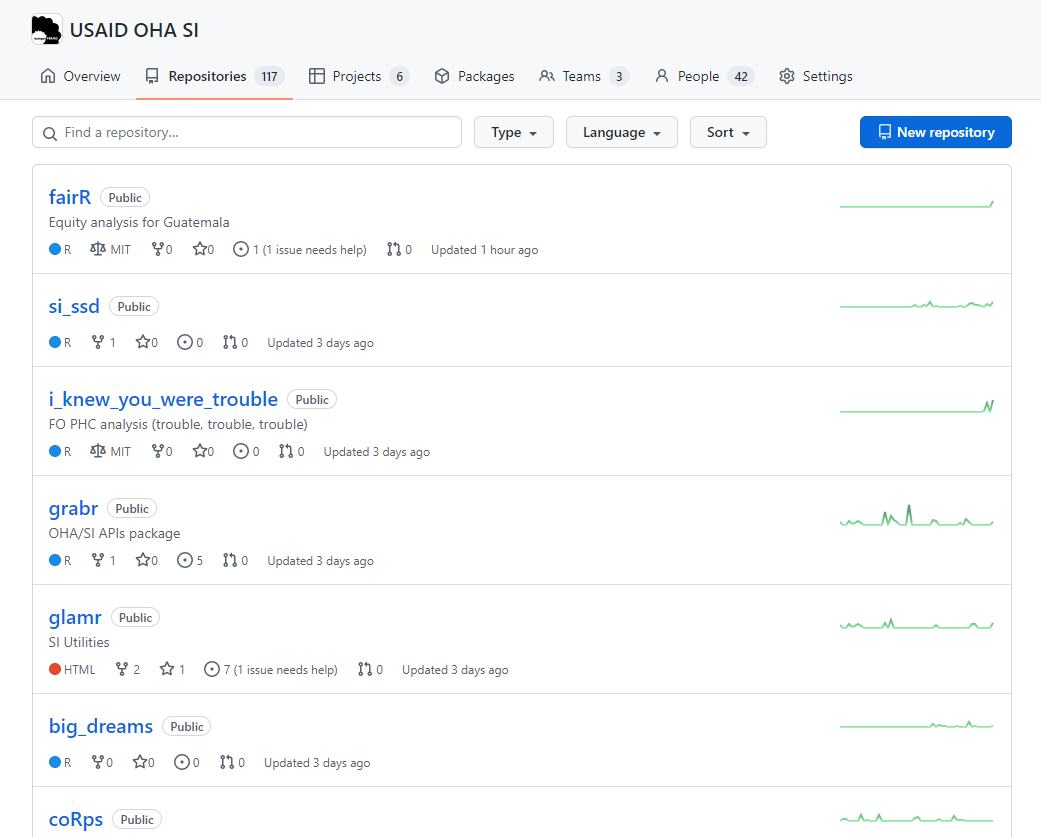
GitHub + Git
Use git locally for version control and Github to store packages and analytic code online. This allows for remote collaboration and serves as a default knowledge management platform.
No data are stored on GitHub – only code.
Tableau
OHA maintains 30+ Tableau Dashboards. Most are linked to our quarterly data (MER) from DATIM. Tableau is a a powerful tool but can quickly create technical debt depending on product ownership.
Excel
Cmmonly used tool among implementing partners and mission staff. Many core PEPFAR products are built in Excel.
![]()
![]()
Can be challenging to create reproducible workflows that can scale.
Adobe Illustrator
Vector graphics editor and design program used for enhancing visualizations and communications products.
And the rest
![]()
![]()

![]()
![]()
![]()
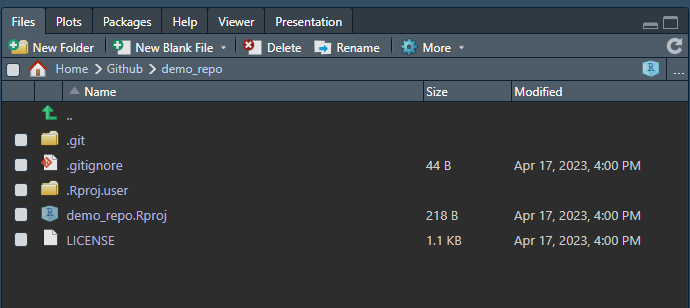
Common Folders
After si_setup()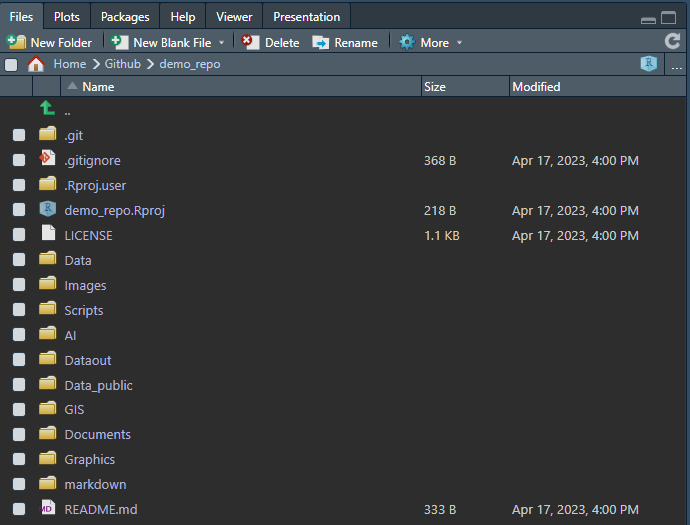
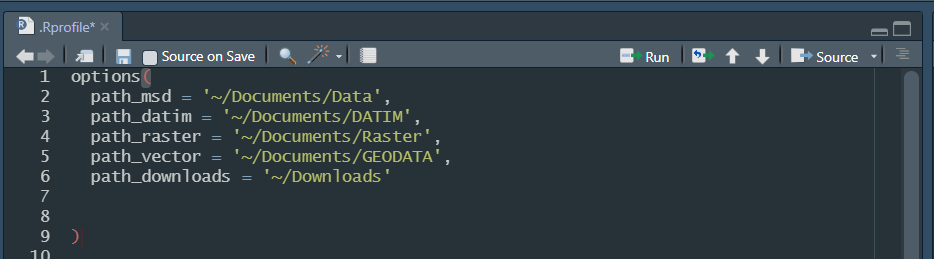
Code Reproducibility through Common Paths
To improve reproducibility of our code and encourage collaboration, we created a function that accesses our central data folder paths stored locally in our
.Rprofile.-
This way, when we are collaborating on code as a team, we don’t need to change any paths manually to adjust for different folder paths from machine to machine.
![]()
Discoverable Content III
coRps
Our mission is to create an inclusive learning/sharing collaborative within USAID’s Office of HIV/AIDS (OHA), where analysts can gain from others’ analytic experiences, primarily in and around R. The coRps is focused on improving R skills and building a culture or R use for the benefit of OHA.
Tableau Learning Collaborative (TLC)
The Tableau Learning Collaborative is a space where staff across OHA can join to learn to use Tableau with PEPFAR data from OHA Tableau users through didactic training sessions and from each other from practical project examples.
The goal of the TLC isto provide continuous learning environment and closer collaboration of OHA analyst to improve quality and standardization of OHA products


Credits
Images from Upslash