95-95-95 Target Progress: Relative Base vs. PLHIV Base
Source:vignettes/relative-plhiv-base.Rmd
relative-plhiv-base.RmdIntroduction
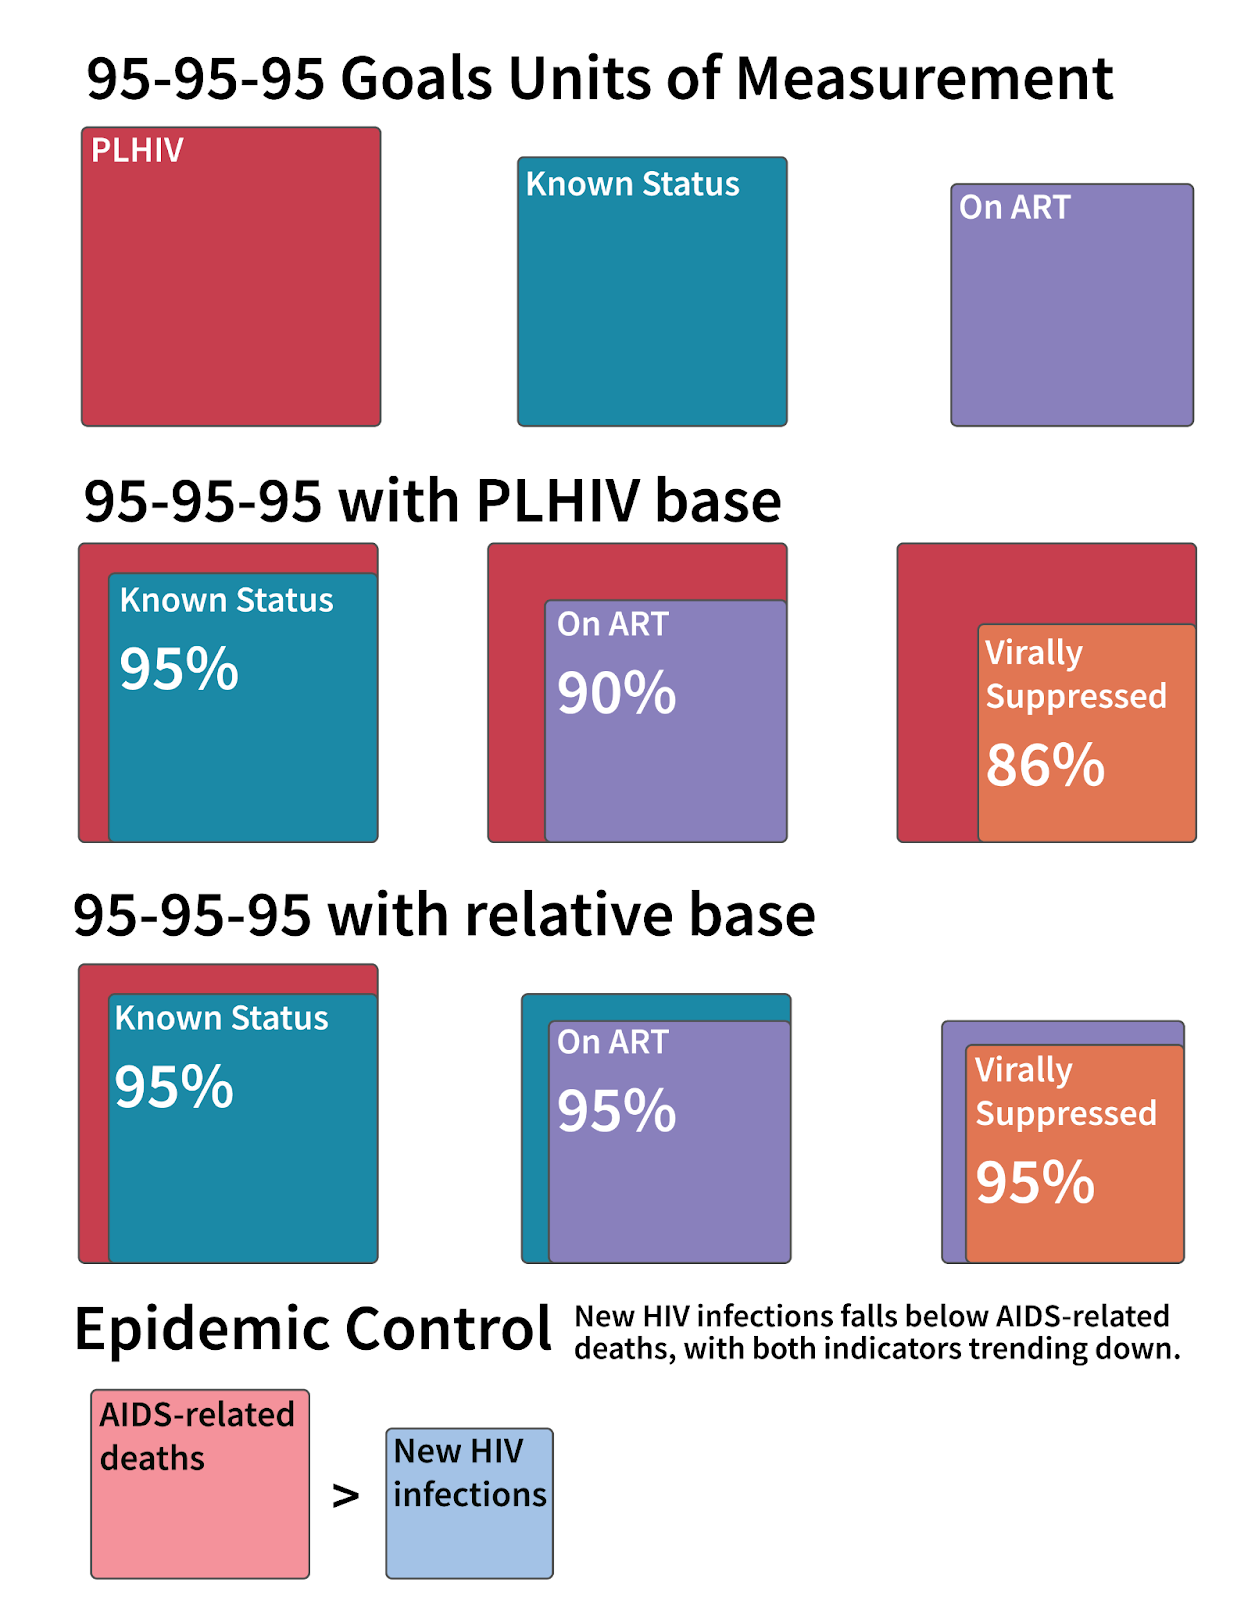
In 2020, UNAIDS updated their Fast Track targets (90-90-90) for 2024 to become the 95-95-95 targets which are set to be achieved by 2030 - 95% of PLHIV know their status, 95% of those who know their status are accessing treatment, and 95% of those who are accessing treatment are virally suppressed.
Importantly, there are two types of metrics to measure 95-95-95 target progress by: the PLHIV base and the relative/conditional denominator base. This vignette will outline the key differences between the two metrics, which UNAIDS indicators to use for each, and how to interpret the different parameters.
Load dependencies
In addition to mindthegap make sure you have
glitr installed. This does not need to be loaded into your
session, but is needed to run the plots. Dependent packages are
typically installed from CRAN, but since our packages are on rOpenSci,
they are not installed.
install.packages('glitr', repos = c('https://usaid-oha-si.r-universe.dev', 'https://cran.r-project.org/'))
#> Installing package into '/home/runner/work/_temp/Library'
#> (as 'lib' is unspecified)What’s the difference between the relative base and the PLHIV base?
The relative base or conditional denominator (based on the targets) is important for countries and programs to know where to focus their response. This metric provides values on a sliding scale, where 95% of PLHIV know their status, 95% of those who know their status are accessing treatment, and 95% of those who are accessing treatment are virally suppressed.
The PLHIV base/denominator (testing and treatment cascade) is best used for comparing countries and for knowing country-specific progress towards curbing their HIV epidemic. With PLHIV as the base for the 3 95’s, the targets become 95% of PLHIV known their status, 90% of PLHIV are accessing treatment, and 86% of PLHIV are virally suppressed.
Both are useful, but for different purposes (see visual below).

How to use UNAIDS Data to Assess 95’s Progress
To assess progress to 95-95-95 targets, we can use the indicators available from EDMS.
- If you are using the relative base to track
95-95-95 progress, use the following indicators from the
"HIV Test & Treat"data tab.-
Percent Known Status of PLHIV: Percent of PLHIV who known their HIV status -
Percent on ART with Known Status: Among those who know their status, percent on ART -
Percent VLS on ART: Among those who are on ART, percent virally suppressed
-
- If you are using the PLHIV base, use the following
indicators from the
"HIV Test & Treat"data tab.-
Percent Known Status of PLHIV: Percent of PLHIV who known their HIV status -
Percent on ART of PLHIV: Among PLHVIV, percent on ART -
Percent VLS of PLHIV: Among PLHIV, percent virally suppressed
-
The package has a built in function, tab_95s, to
generate this as a datatable for you.
Let’s take a deep dive into Namibia’s progress to the 95’s using the PLHIV base.
df_unaids <- load_unaids()
v_plhiv <- tab_95s(df_unaids, "Namibia", denom = "PLHIV", grp = "All")
#> ! Before proceeding, we recommend installing the Source Sans 3 or Source Sans Pro from USAID Software Center or Google Fonts (<https://fonts.google.com/specimen/Source+Sans+3>). In the absense of Source Sans 3 or Pro, we will default to using Arial
v_plhiv| NAMIBIA'S TREATMENT TARGET GOALS | ||||
| 2023 | PLHIV Base | ||||
| indicator | estimate | bounds | goal | achieved |
|---|---|---|---|---|
| All | ||||
| Percent Known Status of PLHIV | 93% | [86%-98%] | 95% | FALSE |
| Percent on ART of PLHIV | 89% | [82%-98%] | 90% | FALSE |
| Percent VLS of PLHIV | 87% | [80%-98%] | 86% | TRUE |
| Source: UNAIDS EDMS Global Data 2024 Release | ||||
As we can see, using the PLHIV base, Namibia reached one of the 95’s - 93% of PLHIV know their status; 89% of PLHIV are accessing treatment; 87% of PLHIV are virally suppressed.
What happens if we use the relative base?
v_relative <- tab_95s(df_unaids, "Namibia", denom = "Relative", grp = "All")
v_relative| NAMIBIA'S TREATMENT TARGET GOALS | ||||
| 2023 | Relative Base | ||||
| indicator | estimate | bounds | goal | achieved |
|---|---|---|---|---|
| All | ||||
| Percent Known Status of PLHIV | 93% | [86%-98%] | 95% | FALSE |
| Percent on ART with Known Status | 95% | [88%-98%] | 95% | TRUE |
| Percent VLS on ART | 98% | [91%-98%] | 95% | TRUE |
| Source: UNAIDS EDMS Global Data 2024 Release | ||||
d_relative <- v_relative$`_data`

df_plhiv_alt <- d_plhiv %>%
  dplyr::select(clean, est_plhiv = estimate) %>%
  dplyr::mutate(est_plhiv = stringr::str_glue("{est_plhiv}%"))

stats_relative <- d_relative %>%
  dplyr::mutate(clean = stringr::str_extract(indicator, "Status|ART|VLS"),
                text = dplyr::case_match(clean,
                                                    "Status" ~ "of PLHIV know their status",
                                                    "ART" ~ "**who know their status** are accessing treatment",
                                                    "VLS" ~ "**who are on treatment** are virally suppressed")) %>%
  dplyr::select(clean, text, estimate) %>%
  # dplyr::left_join(df_plhiv_alt, by = "clean") %>%
  # dplyr::mutate(rel_base_val = lag(est_plhiv)) %>%
  dplyr::mutate(ind = stringr::str_glue("{estimate}% {text}")) %>%
  dplyr::pull() %>%
  paste(collapse = "; ")
Using the relative base, we can see - 93% of PLHIV know their status; 95% who know their status are accessing treatment; 98% who are on treatment are virally suppressed. As such, Namibia meets the 2nd and 3rd 95 with the relative base, but does not reach the 1st 95.
As a result of these differences between the two metrics, the number of PEPFAR countries that have reached all of the 95’s can vary depending on the denominator selected. If we look at the results from 2022, we can see these differences at play.
cntry_epi_plhiv <- df_unaids %>%
  dplyr::filter(year == max(year)-1,
                age == "All",
                sex == "All",
                achv_95_plhiv == TRUE
                ) %>%
  dplyr::distinct(country) %>%
  dplyr::arrange() %>%
  dplyr::pull()


cntry_epi_relative <- df_unaids %>%
  dplyr::filter(year == max(year)-1,
                age == "All",
                sex == "All",
                achv_95_relative == TRUE
                ) %>%
  dplyr::distinct(country) %>%
  dplyr::arrange() %>%
  dplyr::pull()
With the PLHIV base, 5 countries have reached all 3 95’s: Botswana, Rwanda, Zimbabwe, Eswatini, Zambia.
With the relative base, 4 countries have reached all 3 95’s: Botswana, Rwanda, Zimbabwe, Zambia.