Monday Data Viz - 30DayChartChallenge
2021-04-05 Aaron Chafetz
data-viz vizualisation monday-data-viz
Data viz isn’t something learned in a vacuum or isn’t picked up by purely reading a book about it; it takes a lot of practice and learning from others as well. This month is an excellent opportunity to do both of these things with the #30DayChartChallenge.
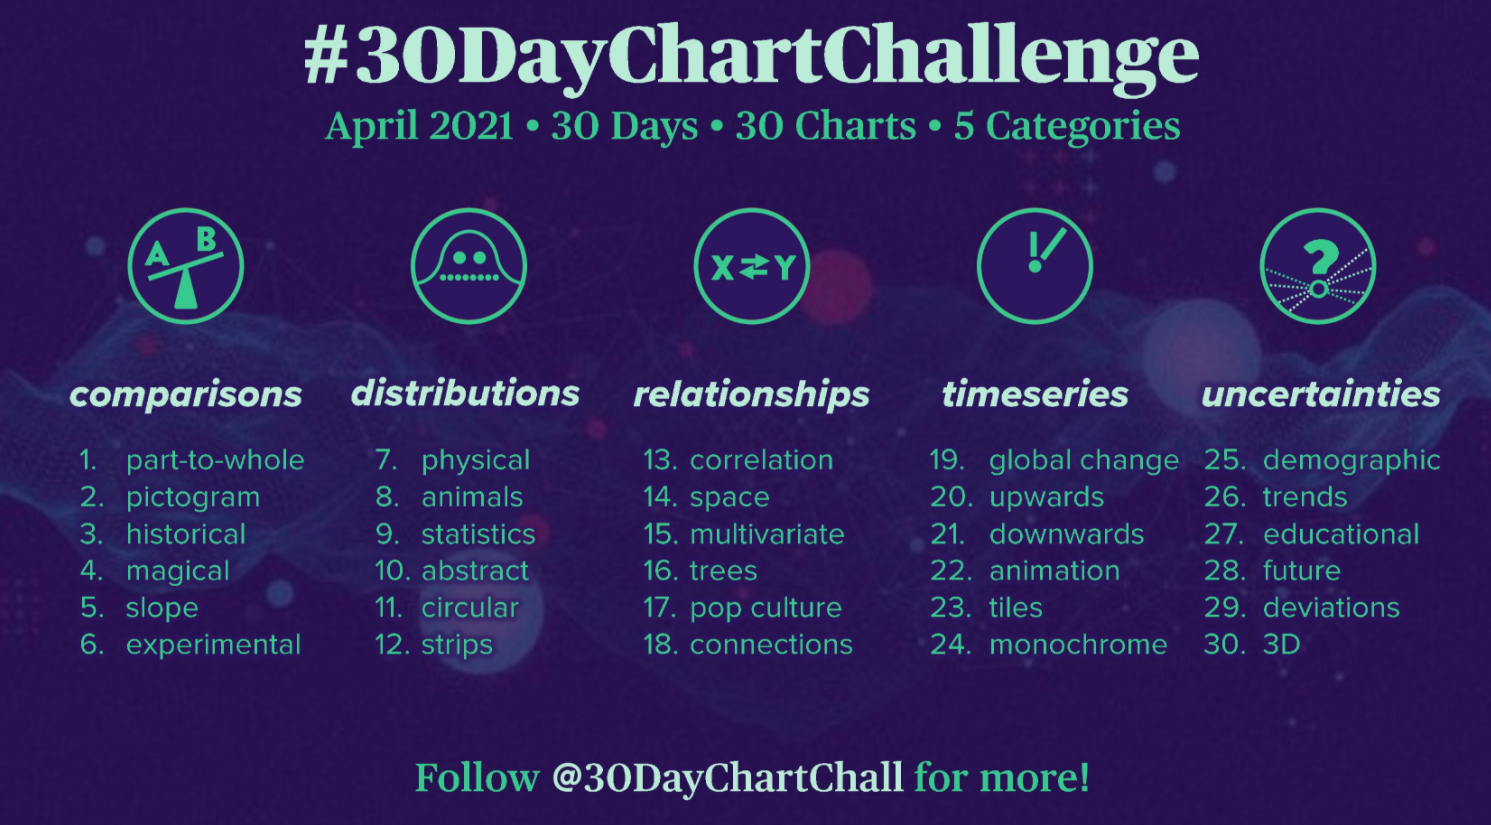
Each day has a different visualization topic, which is a great way to get you out of your comfort zone and test out new techniques or think about things typically outside your wheelhouse. There are also a lot of people posting their own visualizations under this hashtag to follow and be inspired by.
Here’s a few examples from the last few days that might inspire you.
Day 1 - Part-to-Whole
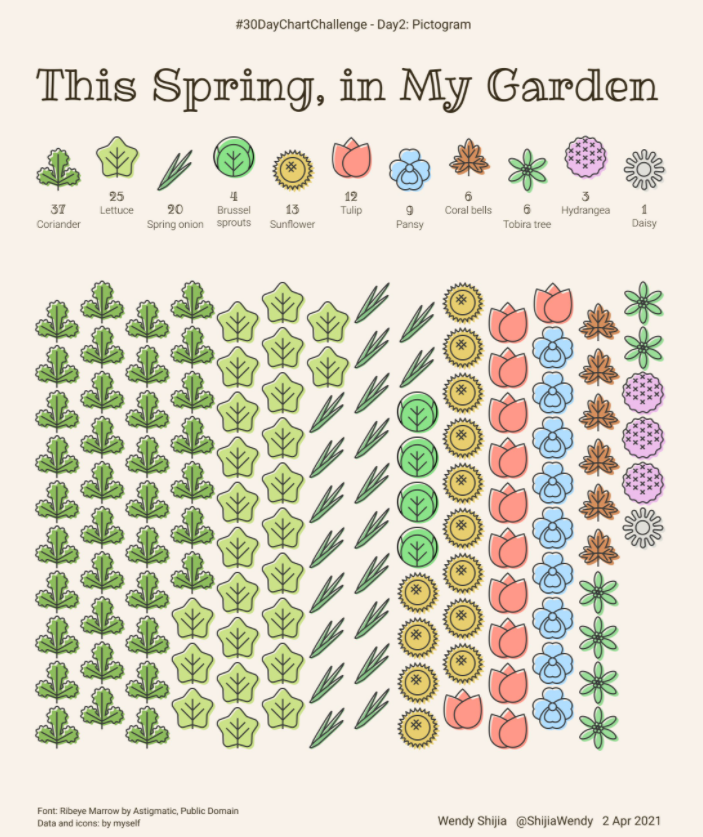
Day 2 - Pictogram
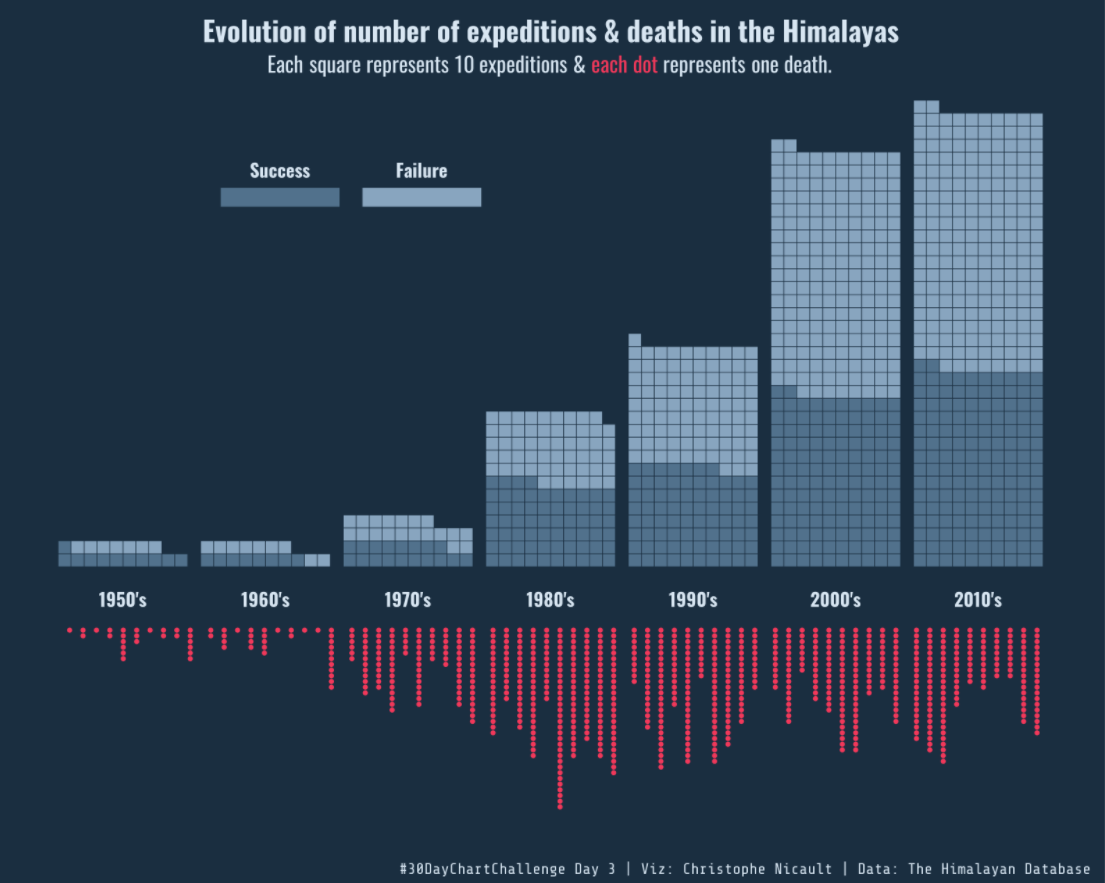
Day3 - Historical
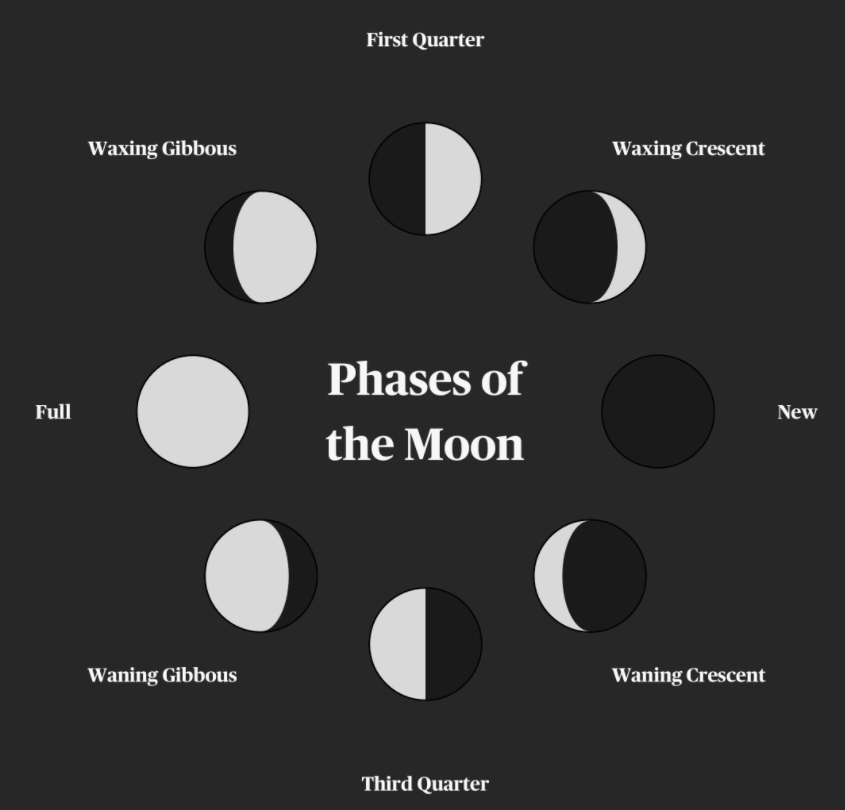
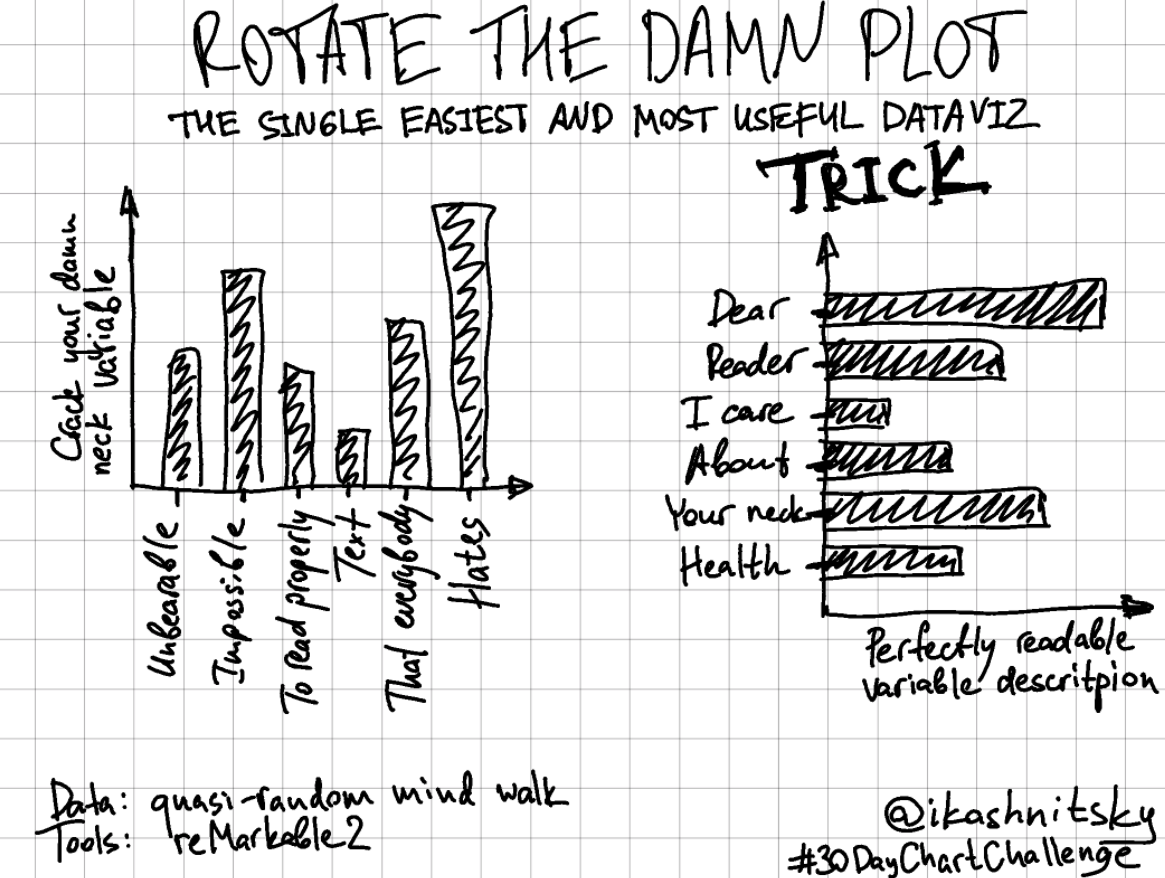
Day 4 - Magical
So get out there, give this a shot and put your data viz skills to the test.
Happy plotting!