Monday Data Viz - Spilt Martini
2021-07-19 Aaron Chafetz
data-viz vizualisation monday-data-viz
When thinking about Tableau, two topics come directly to my mind: dashboards and interactive exploratory analysis. Tableau is such a powerful tool to dig into our data and explore different patterns through a relatively intuitive point and click system. We can drop in data, add different parameters, filter in different ways and explore the different distributions, outliers, trends, etc.
In our office since not everyone has Tableau Desktop, we take advantage of Tableau Server by generating dashboards containing some baked visuals that answer a specific analytical question and allow our colleagues, both at headquarters and the field (bandwidth permitting) to review the data along a few different filter options available to them.
For me, that’s typically where the story ends, thinking about dashboards as just exploratory. But, Gurman Bhatia had an interesting piece in the spring that caused me to reconsider this view as short sided. In her article, Bhatia discusses different formats for efficiently organizing and structuring content delivery. One of those methods is the turned martini glass, where you explain the key topics you want to convey to your reader and then let them explore from there.
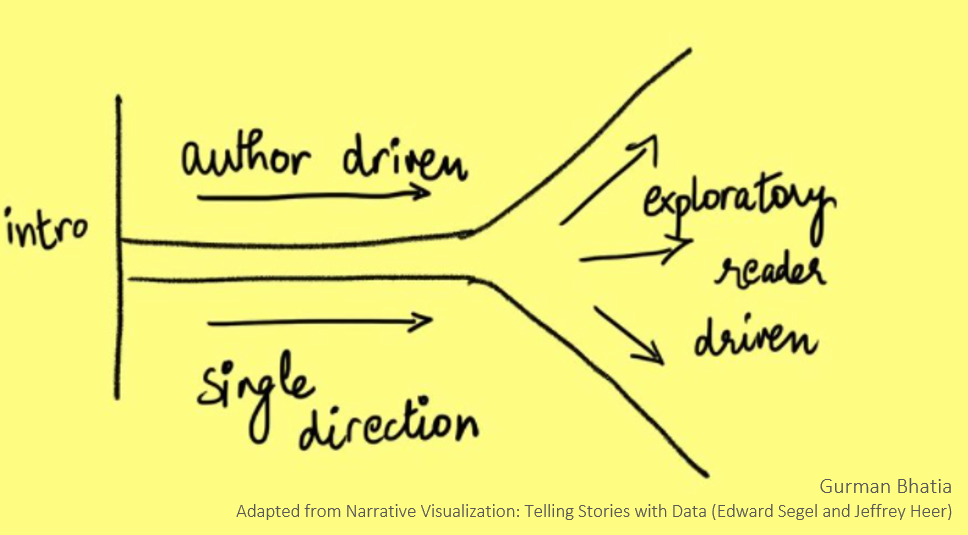
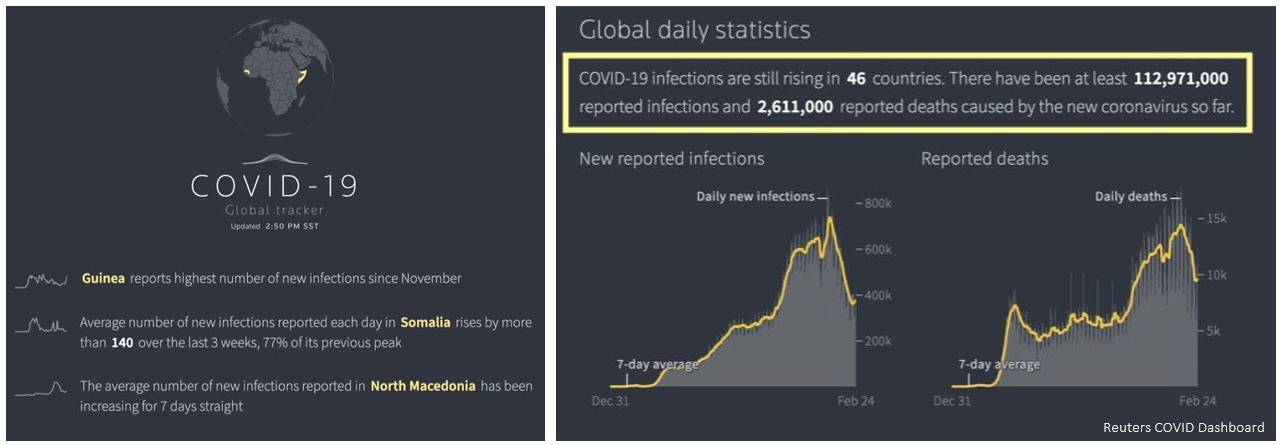
In this section, she makes the point that dashboards are more than just exploratory and interactive but rather “can also be a mix of narrative and exploration” especially when we start weaving in smart/dynamic text. Below are two examples she gives from the Reuters COVID dashboard, where dynamic text helps convey key points to the reader while also alowing the reader to interact with the dashboard itself.
Bhatia leave us with this great quote: “You want to [use] words to compliment the visual elements enhancing the picture without describing what the reader can see herself”.
I think we should take this idea to heart with author driven components to our dashboards, incorporating dynamic text into narrative that adorn our reader driven exploratory visuals.
Happy plotting!