Monday Data Viz - Connecting with Your Data, Part II
2022-07-25 Aaron Chafetz
data-viz vizualisation monday-data-viz
I wanted to follow up on Rohan Jhunja’s amazing Thali chart project that I shared last week, but sharing a project of my own. In March, my wife and I adopted a second dog, Phoebe.
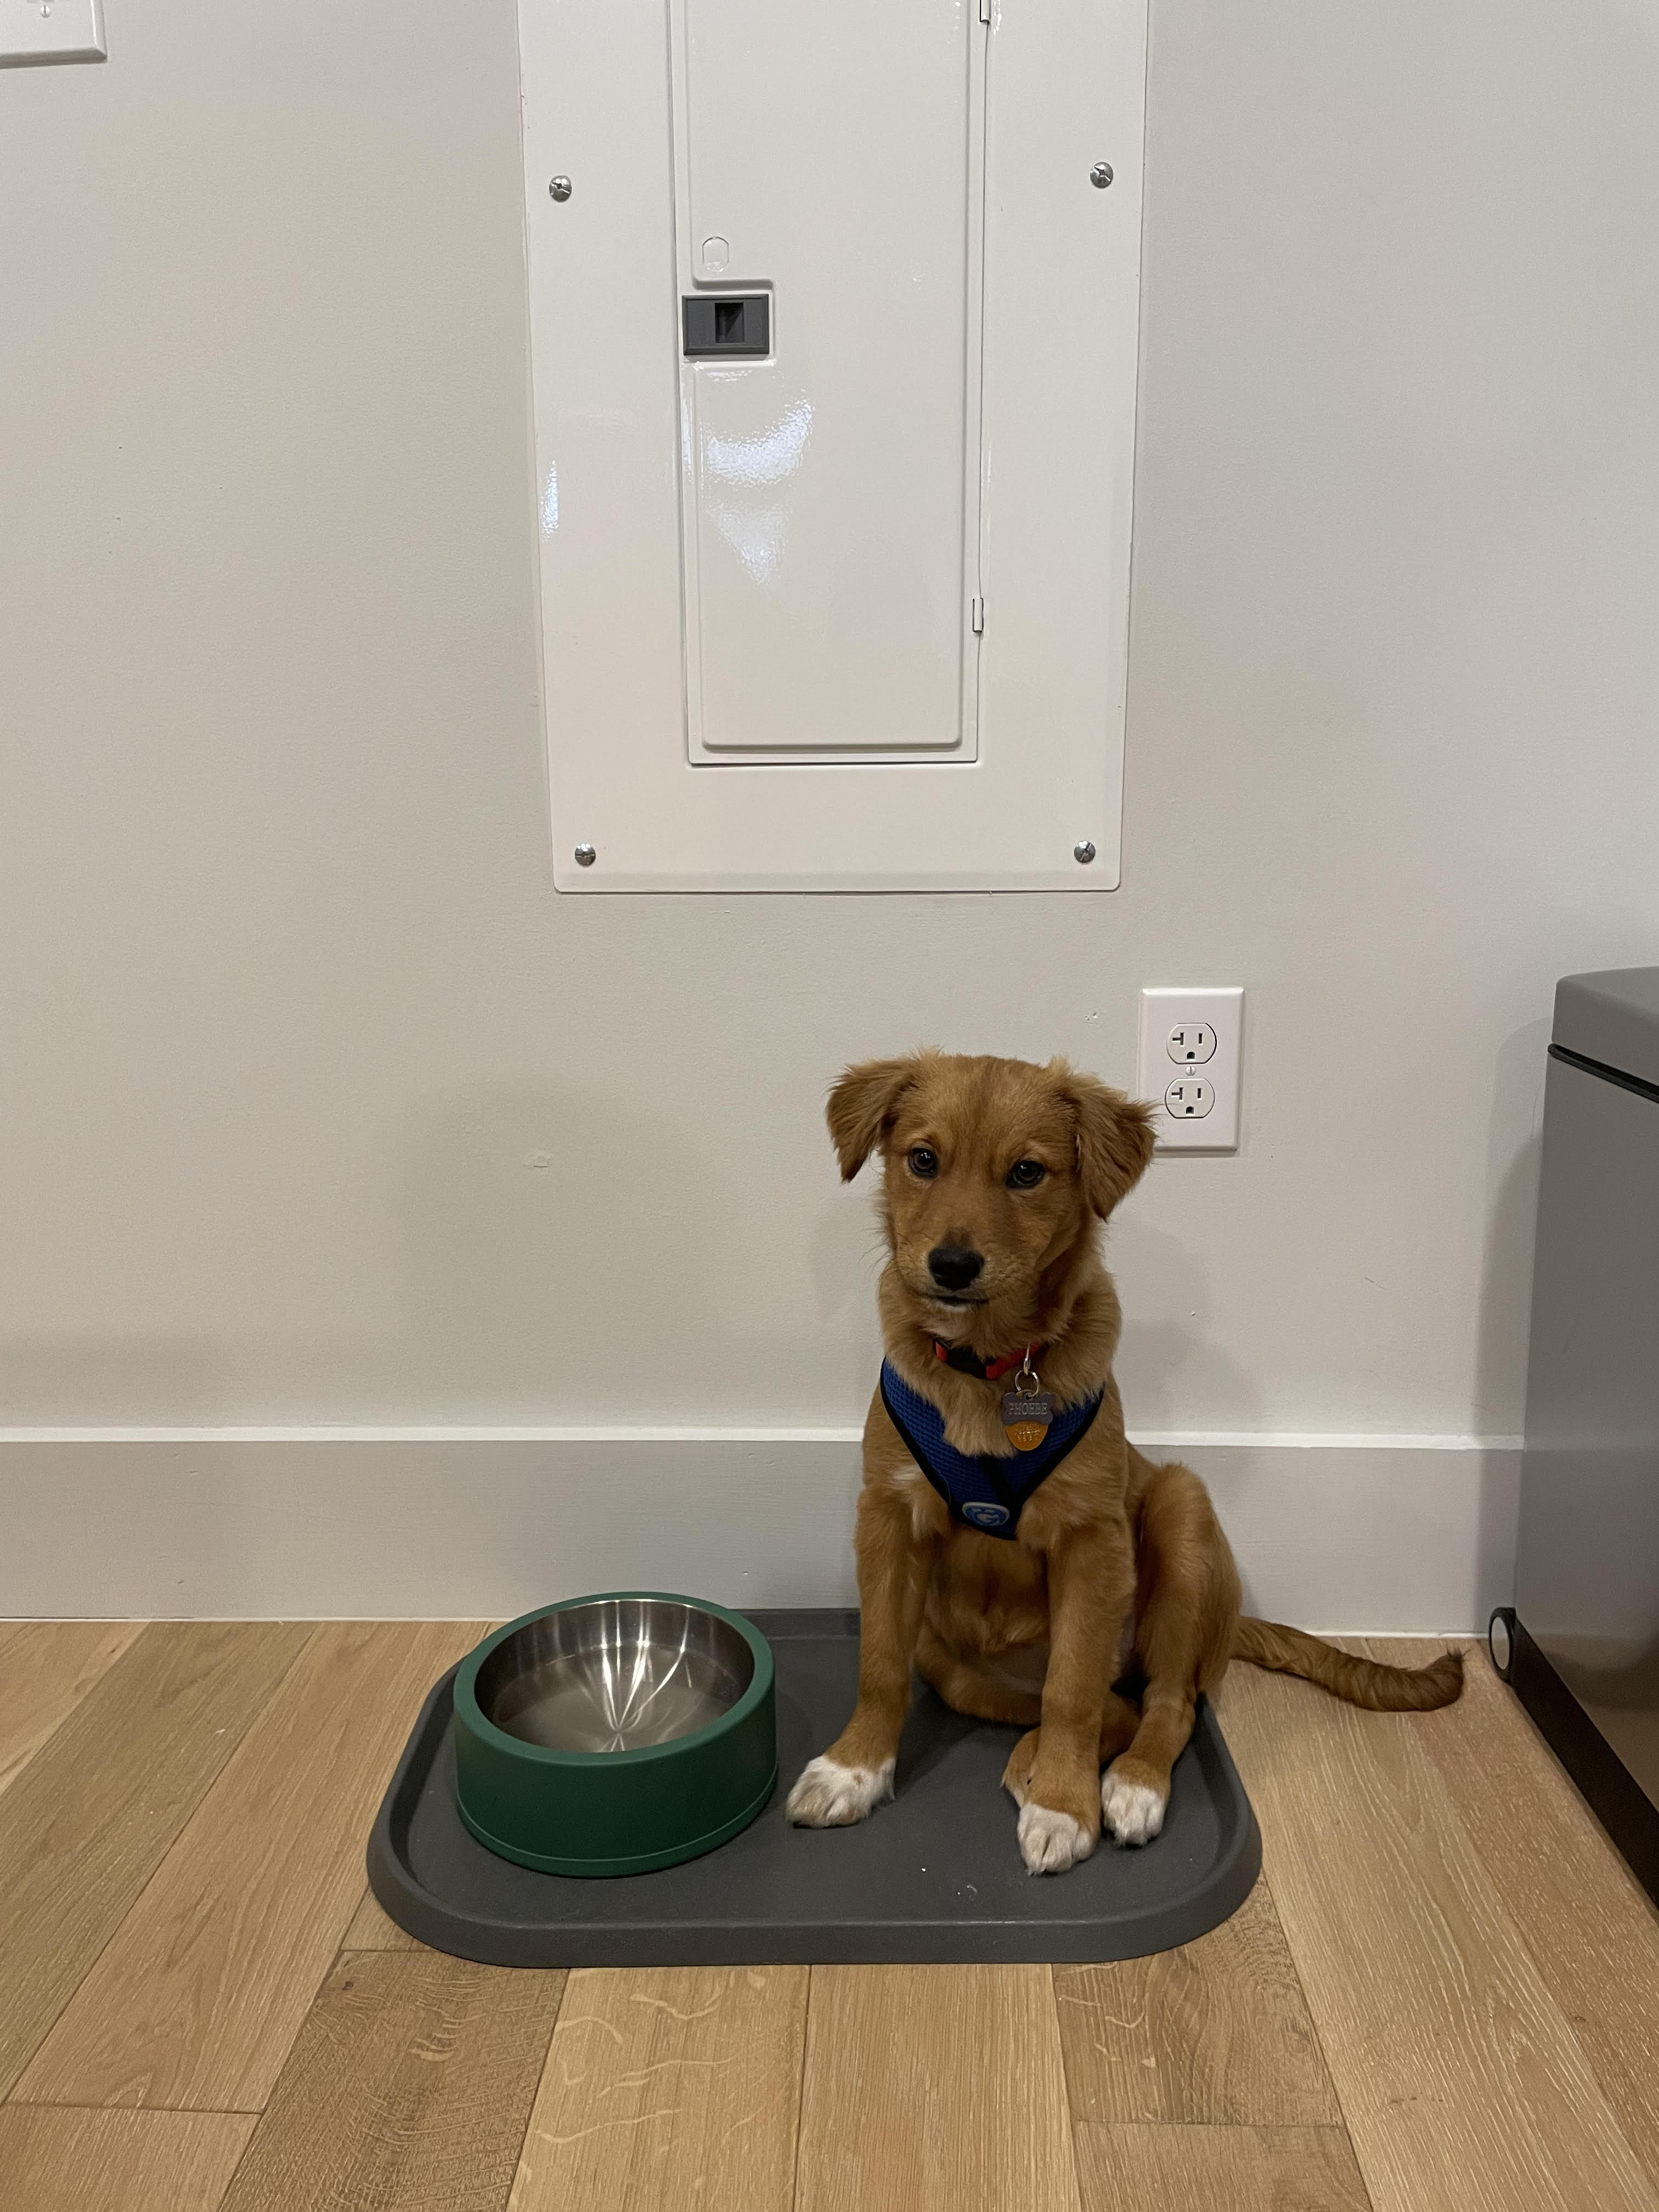
When we adopted Hugo in 2019, I left for Tanzania the day later and when I got back three weeks later, my wife had him house trained. Things were a bit more challenging with Phoebe since she was younger and as it later turned out, had some parasites.
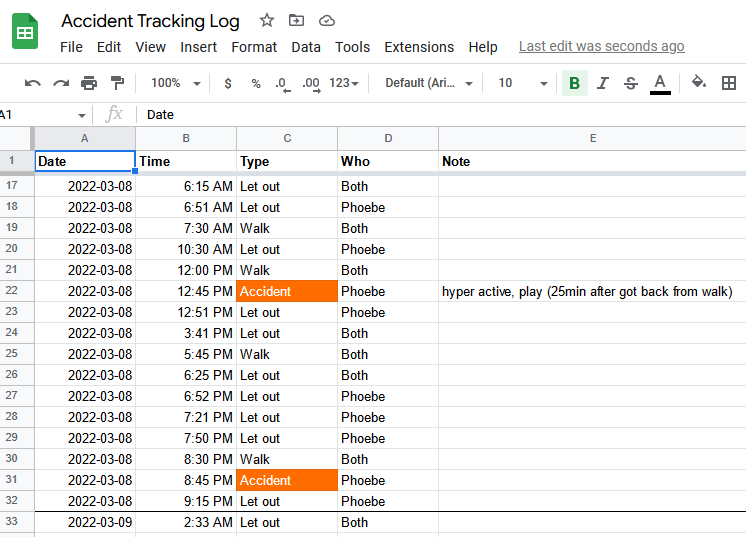
In order to try to stay sane and get a sense of when/why she was having her accidents, we started tracking walks and accidents in Google Sheets.
I plotted the data each week to find patterns and evaluate how we were doing each week. At the end of the data, it wasn’t terribly illuminating - she had most of her accidents at night, most were directly after eating or having the zoomies (and yes, you’ll note there were some very early mornings mixed in).
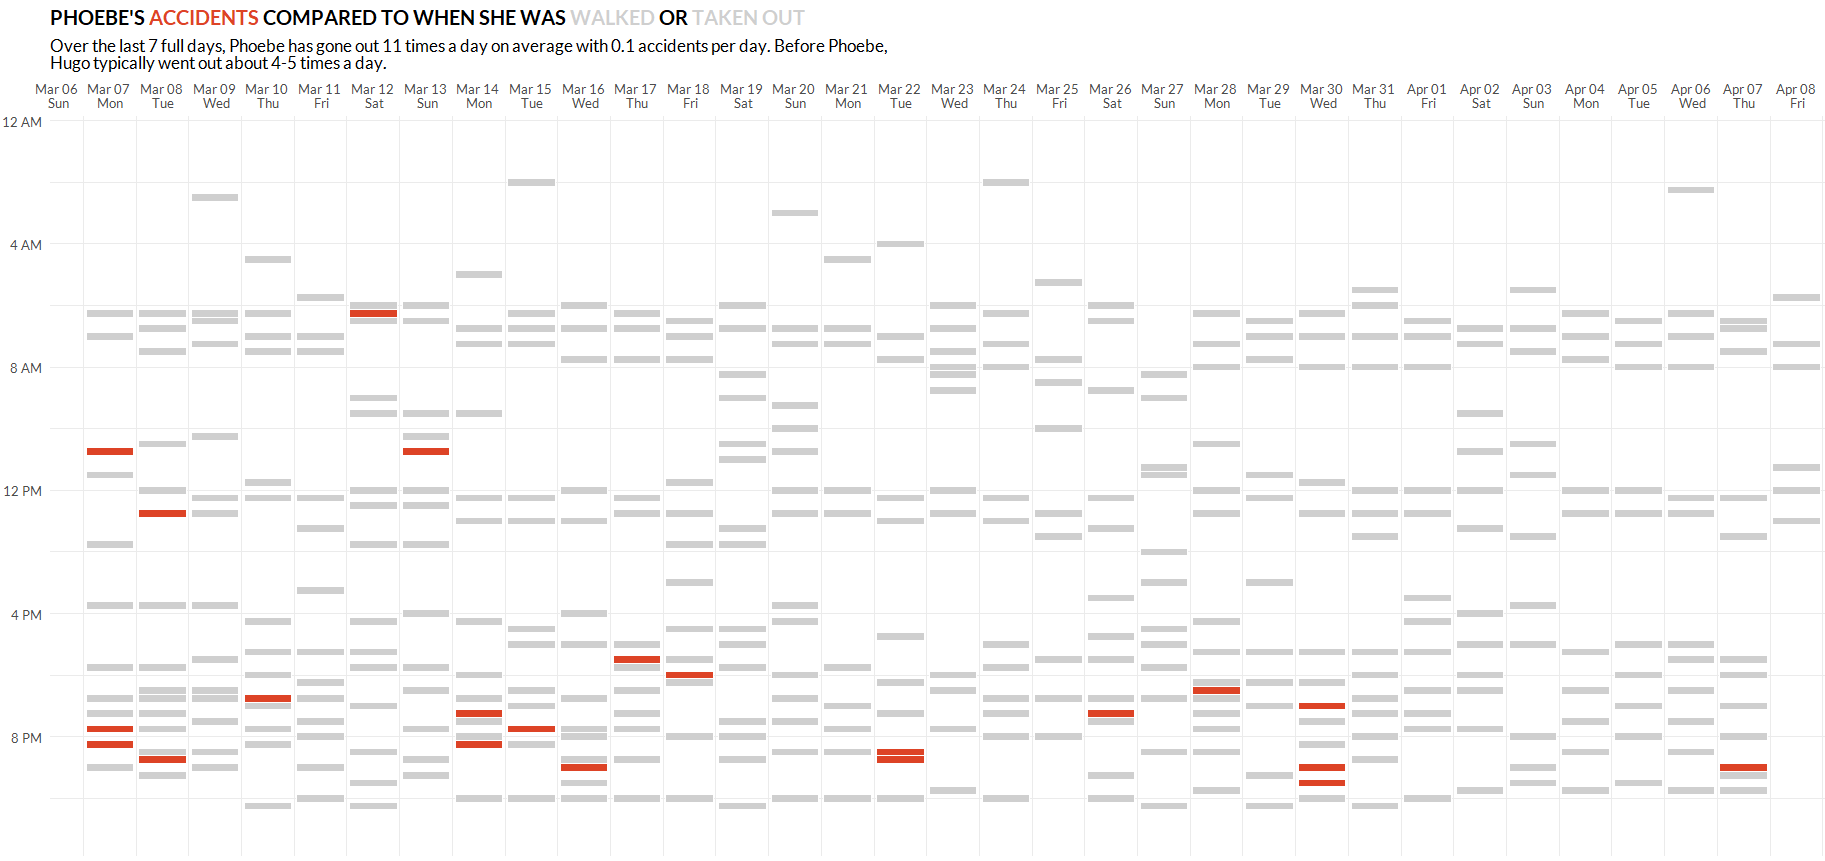
The good news is Phoebe is by and large house broken, though we do still get in quite a few walks a day. While not as inspiring as Rohan Jhunja’s work, this was still a fun project for me, doing both the data capture and the viz.
Happy plotting!