RBBS - 9 Relational Data - Part 2
2022-05-09 Baboyma Kagniniwa
corps rbbs r
Relational Data - Part two, Deep dive into joins …
Introduction
For today’s session, we are still covering Relational Data.
We will be using primary dplyr from tidyverse to demonstrate how to work with relational data and will also touch on other packages demonstrated in previous RBB sessions.
This session covers a bit of the Computer Science / Information Technology concepts and much of the content comes from Chapter 13 of R for Data Science Book.
Learning Objectives
- Summary of Part One & Follow up
- Deep Dive into Joins - left, right, inner, full
- Filtering Joins -
Semi&AntiJoins - Combining data set with
bind_rows - Getting insights from dplyr operations with
tidylog
Recordings and Materials
Today’s recordings (for USAID staff only), code, and materials will be shared through the coRps Presentations & Recordings Google Spreadsheet, accessible through coRps calendar invite.
Relational Data
See part one of this session for definition and other concepts.
Relational data is a collection of multiple tables of data related to one another by key variables. The relations between tables is more important than the individual table.
Let’s revisit the MER Structured Dataset (MSD) we used during last session:
Load Libraries
library(tidyverse) # Data munging
library(glamr)     # OHA Utilities
library(gophr)     # OHA MSD Functions
library(tidylog)   # Notifications for all operations / functions
Load Data
dir_msds <- si_path(type = "path_msd")

file_site_im_msd <- return_latest(
  folderpath = file.path("..", dir_msds),
  pattern = "^MER_.*_Site_IM_FY20-22_\\d{8}_.*_Nigeria.zip")

df_msd <- read_msd(file = file_site_im_msd)
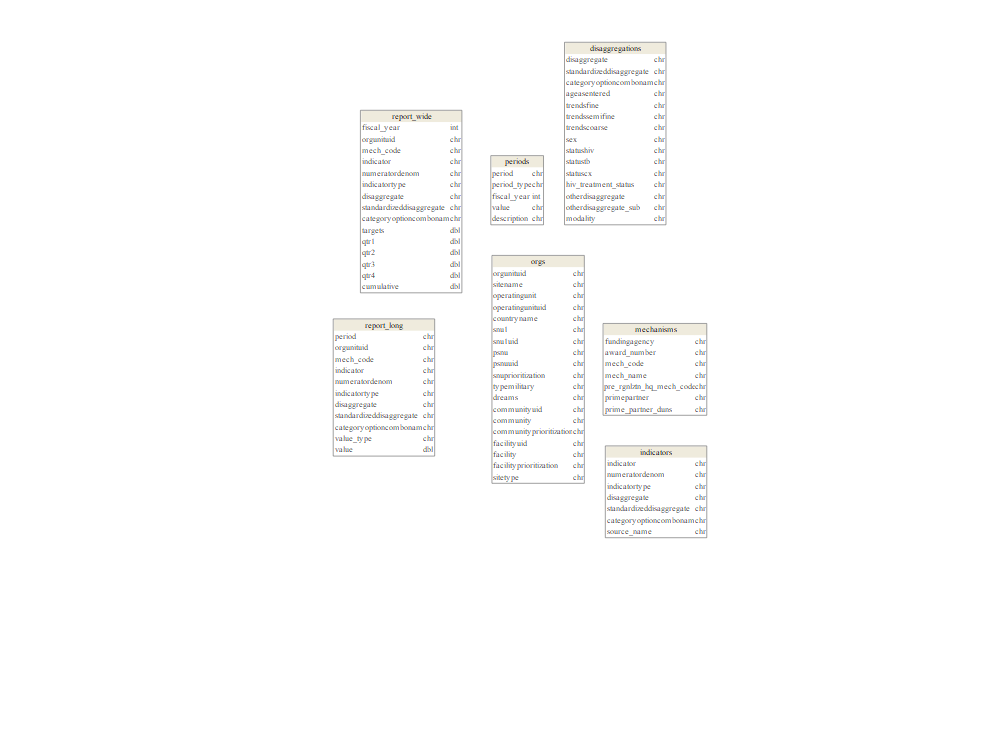
MSD Structure and - Reference tables
MSD - Site by IM data sets comes with ~52 columns
Rows: 3,176,685
Columns: 52
...
$ sitename                 <chr> "Data reported above Site level", "Dukku ~
...
The data sets include 5 key reference tables & the program data:
Organizational HierachyImplementing MechanismsData Elements & DisaggregationsReporting PeriodsProgram - Results Data
# Org H.
df_orgs <- df_msd %>%
  filter(fundingagency != "Dedup") %>%
  select(all_of(str_msd_sites$orgunits)) %>%
  distinct()

# Mechs
df_mechs <- df_msd %>%
  filter(fundingagency != "Dedup") %>%
  select(all_of(str_msd_sites$mechanisms)) %>%
  distinct()

# Indicators
df_inds <- df_msd %>%
  filter(fundingagency != "Dedup") %>%
  select(all_of(str_msd_sites$indicators)) %>%
  distinct()

df_disaggs <- df_msd %>%
  filter(fundingagency != "Dedup") %>%
  select(all_of(str_msd_sites$disaggregates)) %>%
  distinct()

# Reporting Periods
df_periods <- df_msd %>%
  filter(fundingagency != "Dedup") %>%
  select(all_of(str_msd_sites$periods)) %>%
  pivot_longer(cols = -fiscal_year,
               names_to = "quarter",
               values_to = "value") %>%
  select(-value) %>%
  distinct() %>%
  mutate(value = str_remove(quarter, "qtr"),
         period_type = "quarterly",
         description = case_when(
           value == 1 ~ "October to December",
           value == 2 ~ "January to March",
           value == 3 ~ "April to June",
           value == 4 ~ "July to September"
         ),
         period = paste0("FY", str_sub(fiscal_year, 3, 4), "Q", value)) %>%
  select(period, period_type, fiscal_year, -quarter, value, description)

# add annual periods
df_periods <- df_periods %>%
  distinct(fiscal_year) %>%
  mutate(period = paste0("FY", str_sub(fiscal_year, 3, 4)),
         period_type = "yearly",
         value = NA_character_,
         description = "October to September") %>%
  select(period, period_type, fiscal_year, value, description) %>%
  bind_rows(df_periods)


# Data / Reports -> Note no distinct used here
df_report_wide <- df_msd %>%
  filter(fundingagency != "Dedup") %>%
  select(all_of(str_msd_sites$data))

# Data / Reports - Long Format
df_report_long <- df_report_wide %>%
  reshape_msd() %>%
  rename(value_type = period_type)
All Tables
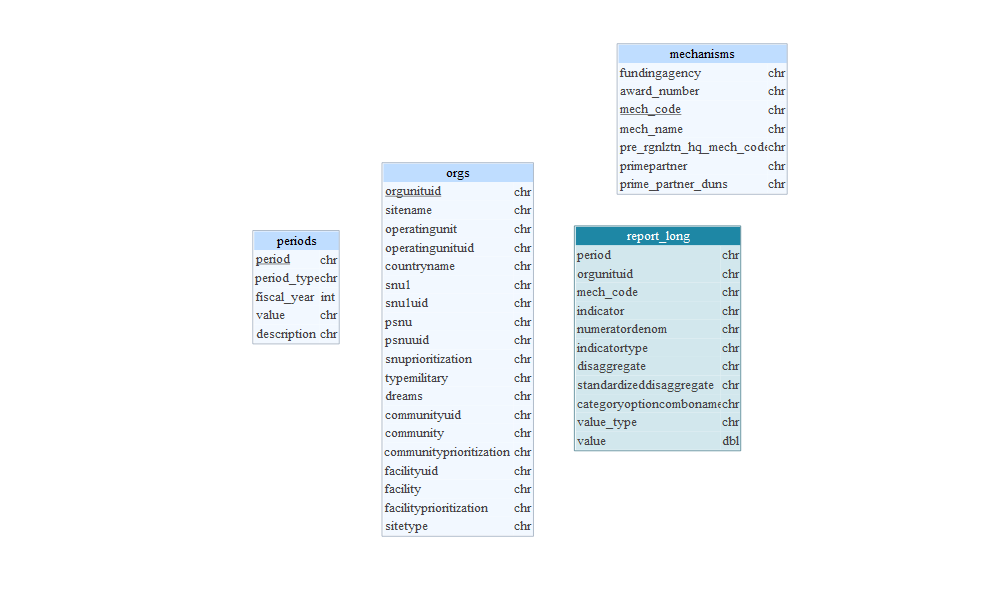
Identify Primary Keys
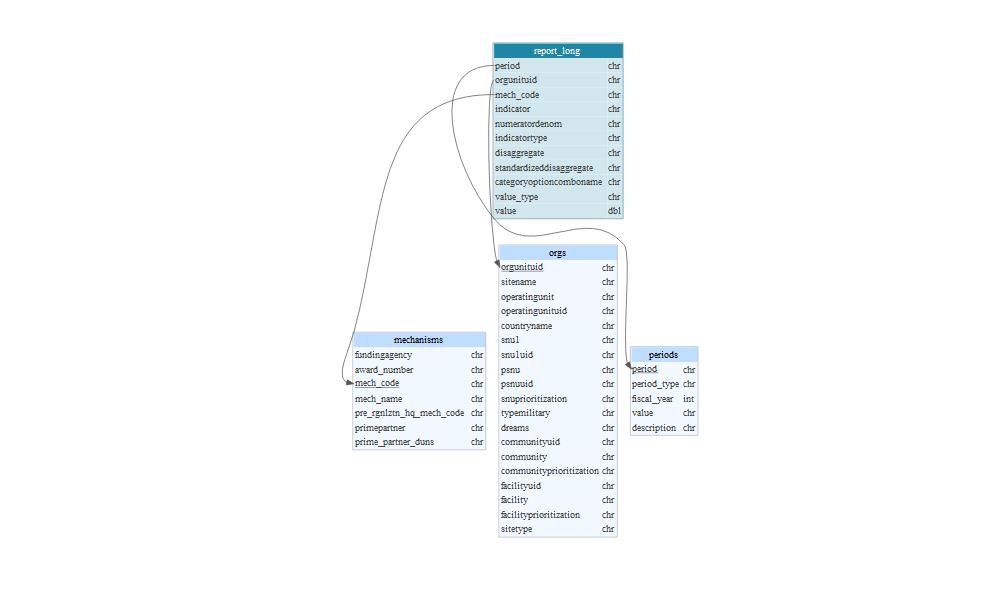
Identify Foreign Keys
Combining data sets through Joins
There are multiple type of join:
Inner Joinmatches pairs of observations whenever their keys are equalOuter Joinkeeps observations that appear in at least one of the table.Left Joinkeeps all the observations in the left side tableRight JoinKeeps all the observations in right side tableFull Joinkeeps all the observations in both tables
Joins Diagram
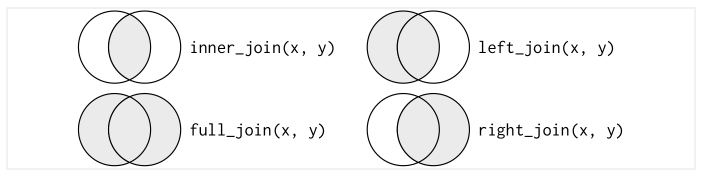
Note: These joins (from dplyr package) are similar to merge function from base R.
Eg: merge(x, y, all.x = TRUE) is similar to dplyr::left_join(x, y, by = 'abc')
Examples - Joins
# Sample Results Data
df_results_tx <- df_report_long %>%
  mutate(indicator = str_strim(indicator, side="both")) %>%
  filter(str_detect(period, "^FY22"),
         value_type == "results", indicator == "TX_CURR",
         standardizeddisaggregate == "Age/Sex/HIVStatus") %>%
  select(period, orgunituid, mech_code, indicator, value) %>%
  slice_sample(n = 15)

# Narrow down mechs
df_mechanisms <- df_mechs %>%
  filter(fundingagency == "USAID") %>%
  select(fundingagency, mech_code, mech_name, primepartner)

# Change Mechanism Code colunm name
df_mechanisms2 <- df_mechanisms %>%
  rename(mechanism_id = mech_code)
Examples - Inner Join
df_results_tx %>%
  inner_join(x = .,
             y = df_mechanisms,
             by = "mech_code")
Examples - Left Join
df_results_tx %>%
  left_join(x = .,
             y = df_mechanisms2,
             by = c("mech_code" = "mechanism_id"))
Examples - Right Join
df_results_tx %>%
  right_join(x = .,
             y = df_mechanisms2,
             by = c("mech_code" = "mechanism_id"))
Examples - Full Join
df_results_tx %>%
  full_join(x = .,
            y = df_mechanisms2,
            by = c("mech_code" = "mechanism_id"))
Semi & Anti Joins
Semi and Anti joins are filtering joins, as oppose to mutating joins (inner, left, right and full). These type of joins affect the observations (not the variables).
There are 2 types of filtering joins:
-
semi_join(x, y), keeps all observations in x that have match in y. This join is good for matching a filtered summary table to the original rows. -
anti_join(x, y), drops all observations in x that have match in y. This join is good for diagnosing join mismatches.
Semi Join - Examples
Mechanisms reporting more Patients on ART
df_mechs_sum <- df_results_tx %>%
  group_by(period, mech_code) %>%
  summarise(mech_value = sum(value, na = TRUE), .groups = "drop") %>%
  filter(mech_value > 100)
Filter the original data set based of the summary
df_mech_tx <- df_results_tx %>%
  filter(mech_code %in% df_mechs_sum$mech_code)
The 2 operations above can be done with semi_join() function
df_mech_tx <- df_results_tx %>%
  semi_join(x = ., y = df_mechs_sum, by = "mech_code")
Anti Join - Examples
Identify matched observations
df_results <- df_results_tx %>%
  left_join(df_mechanisms, by = "mech_code")
Retain only mismatched observations
df_results <- df_results %>%
  filter(is.na(fundingagency)) %>%
  select(-c(fundingagency:last_col()))
anti_join() will not only identify of matched observations but will also drop them
df_results <- df_results_tx %>%
  anti_join(df_mechanisms, by = "mech_code")
Other ways of combining mutiple data sets
There are situations where analysts receive multiple data sets containing the same set / type of columns and need to combine them into a single data frame for the analyses.
This can be accomplished using dplyr::bind_rows()
Note: bind_rows takes an infinite number of data frames and all columns will be re-arranged to match the order of columns in the first data frame.
An .id parameter can also be supplied to identify all data sets.
dplyr has a function named bind_cols(), the opposite of bind_rows(), useful for combining data sets with same number of rows. Keep in mind that the order of observations in all data sets matters.
Examples - bind_rows
df_tx_curr <- df_report_long %>%
  filter(str_detect(period, "^FY22"),
         value_type == "results", indicator == "TX_CURR",
         standardizeddisaggregate == "Age/Sex/HIVStatus") %>%
  select(period, orgunituid, mech_code, indicator, value) %>%
  slice_sample(n = 20)

df_tst_pos <- df_report_long %>%
  filter(str_detect(period, "^FY22"),
         value_type == "results", indicator == "HTS_TST_POS",
         standardizeddisaggregate == "Modality/Age/Sex/Result") %>%
  select(period, indicator, value, orgunituid, mech_code) %>%
  slice_sample(n = 20)

bind_rows(df_tst_pos, df_tx_curr)
Notifications with tidylog
tidylog is an R Package designed to provide feedback about dplyr and tidyr operations.
df_results_tx %>%
  inner_join(x = .,
             y = df_mechanisms,
             by = "mech_code")
inner_join: added 3 columns (fundingagency, mech_name, primepartner)
            > rows only in x  ( 9)
            > rows only in y  (11)
            > matched rows      6
            >                 ====
            > rows total        6