Monday Data Viz - Annotate, Annotate, Annotate
2021-03-08 Aaron Chafetz
data-viz vizualisation monday-data-viz
As I got started with data viz, I thought the secret to going from a standard graphic to a stellar one was all software based; what cutting edge software is going to allow me to show things with my data that allows me to show data in innovative ways to make my point. But over time, I’ve found that the key to creating informative graphics is right in front of all of us - our keyboards. Adding context to our plots amplies not just a narrative, but drives home the message we want our audience to come away with and provides key context.
On an older blog post on her Storytelling With Data blog, Cole Nussbaumer Knaflic makes these important points
Don’t assume that two different people looking at the same data visualization will walk away with the same conclusion. Which means, if there is a conclusion you want your audience to reach, you should state it in words. Use what we know about preattentive attributes to make those words stand out: make them big, leverage color and/or bold, and put them in high priority places on the page like the top.
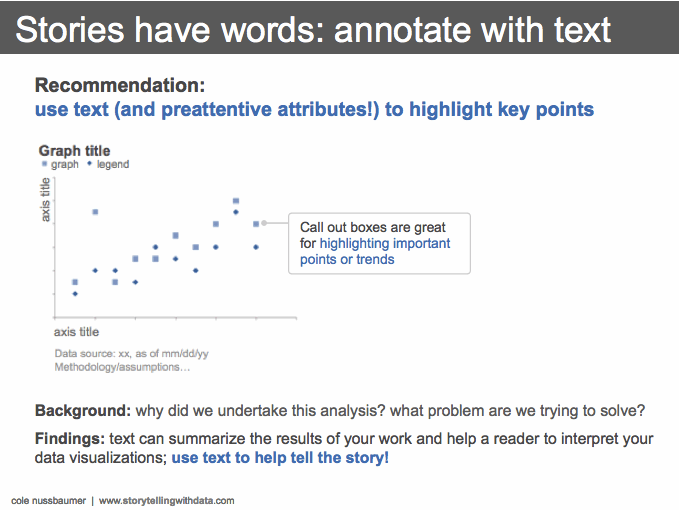
Cole emphasizes active chart titles over descriptive ones as an important element as well as the use of text to call out important points.
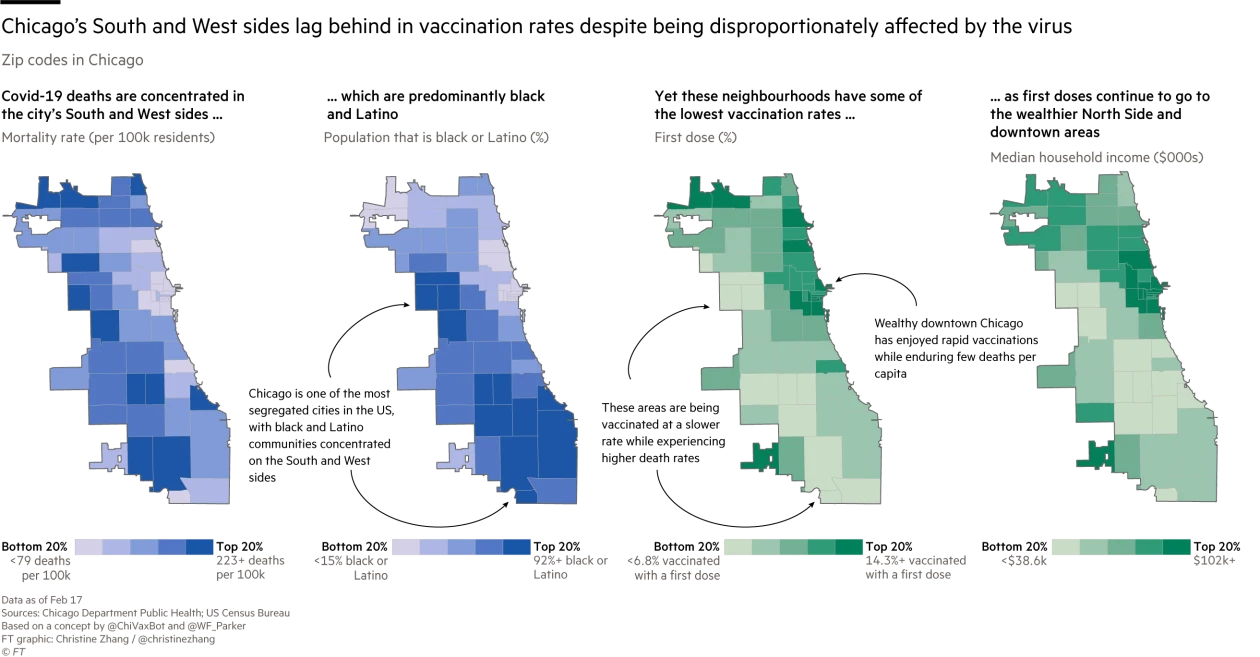
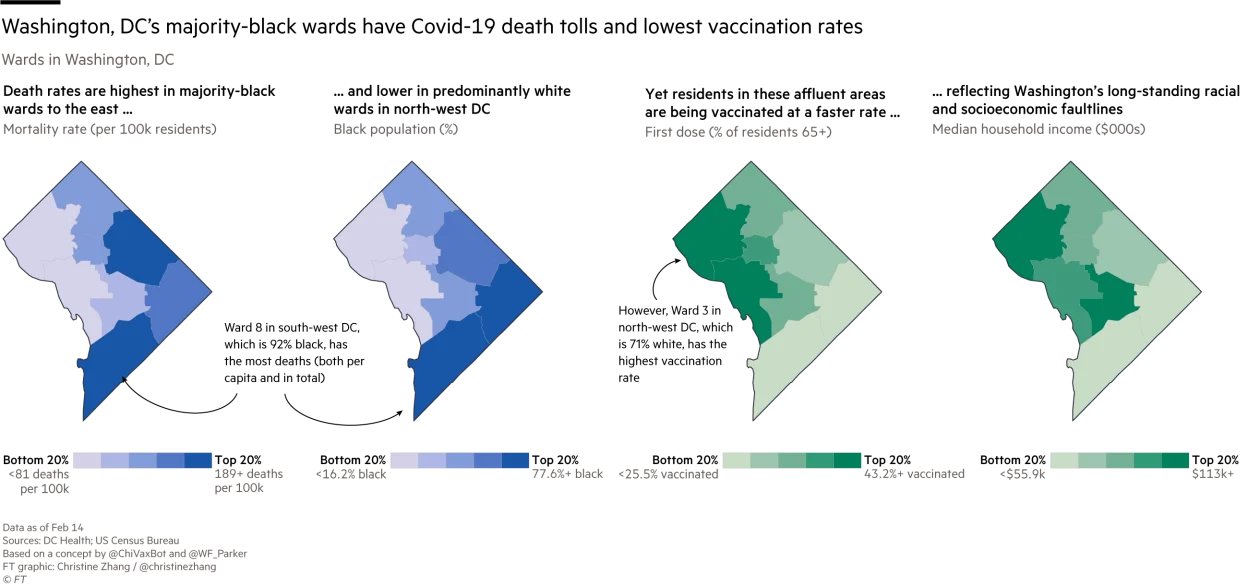
The Financial Times has a stellar data team and produces plenty of examples of what Cole raises. I really like these examples from a recent COVID article they produced on vaccine roll out. Christine Zhang uses active titles and subtitles, tells a story across their series of plots, and provides important context with annotation callouts. They also make great use of their typography hierarchy, emphasizing their titles in bold and large size and minimizing the attention to creating text, like the source and notes, with smaller and lighter text.
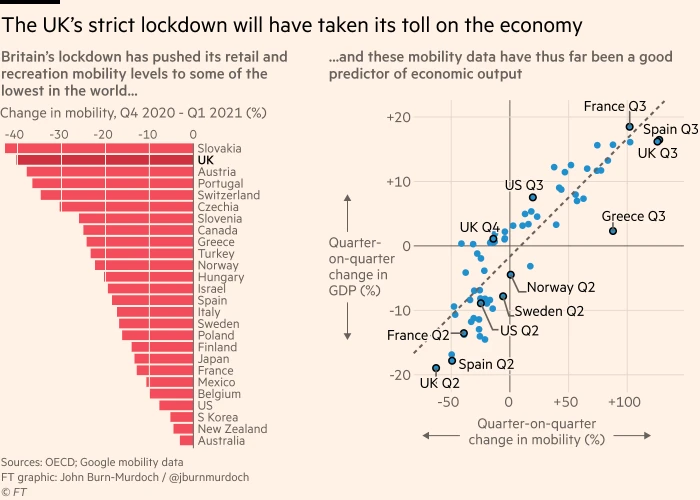
Alight, one more FT example since I couldn’t resist one from John Burn-Murdoch. Sames points as above, but also the use of preattentive attributes (color/size) to call out the UK on the left visual and labeling of limited/relevant comparators on the right.
Take the time to add some text to your graphic, both through active titles and annotations to drive the message home to your audience.