Monday Data Viz - The Urban Exodus
2022-09-19 Aaron Chafetz
data-viz vizualisation monday-data-viz
I’m teleworking today and writing this from home, which is pretty typical of about a third of American workers since about mid 2021 (down from its peak of an estimated +60% in 2020). These facts from Andrew Van Dam’s Washington Post article from last month reporting on a recent paper by a few economists, polling data from the Post and Gallup, and Census Bureau data.
Van Dam’s article provides quite a number of data points. which comes as no surprise since this is part of his weekly column - The Department of Data, but what stuck with me still weeks after the article was published was the latter half which focuses on estimating the geographic effects of remote work. To do this, Van Dam plotted Census data to show what counties lost/gained populations (25-49) between 2020 and 2021. Rather than going the choropleth map route (coloring counties by their gains/losses), Van Dam depicts the size of the population trend through symbols (arrows).
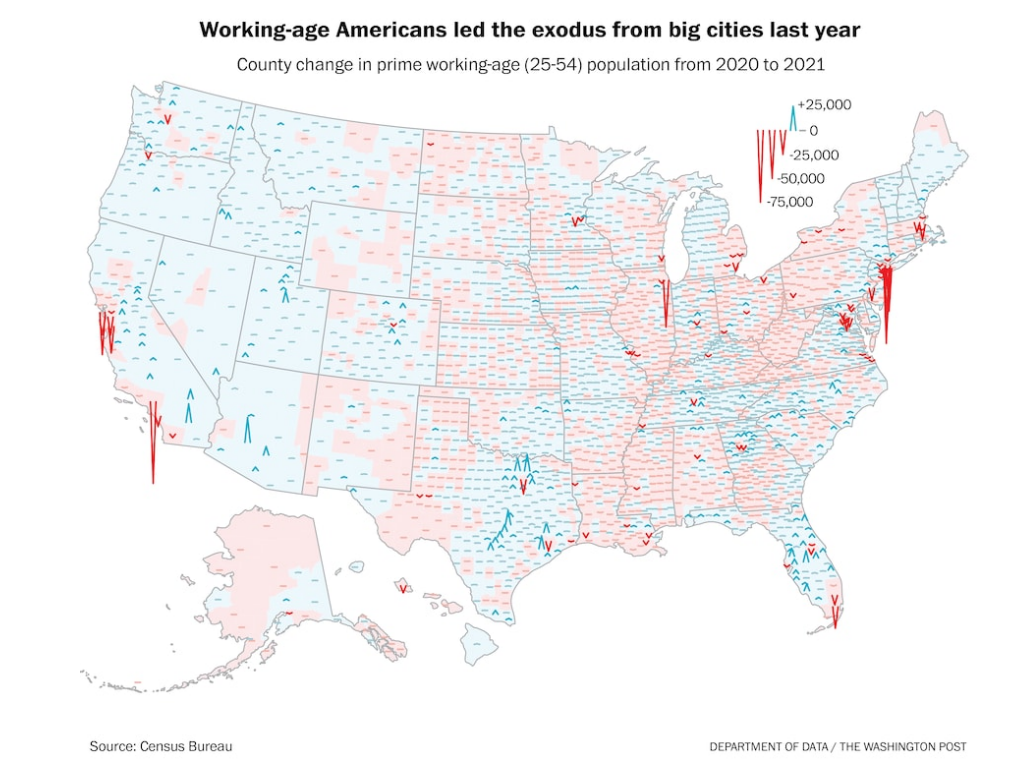
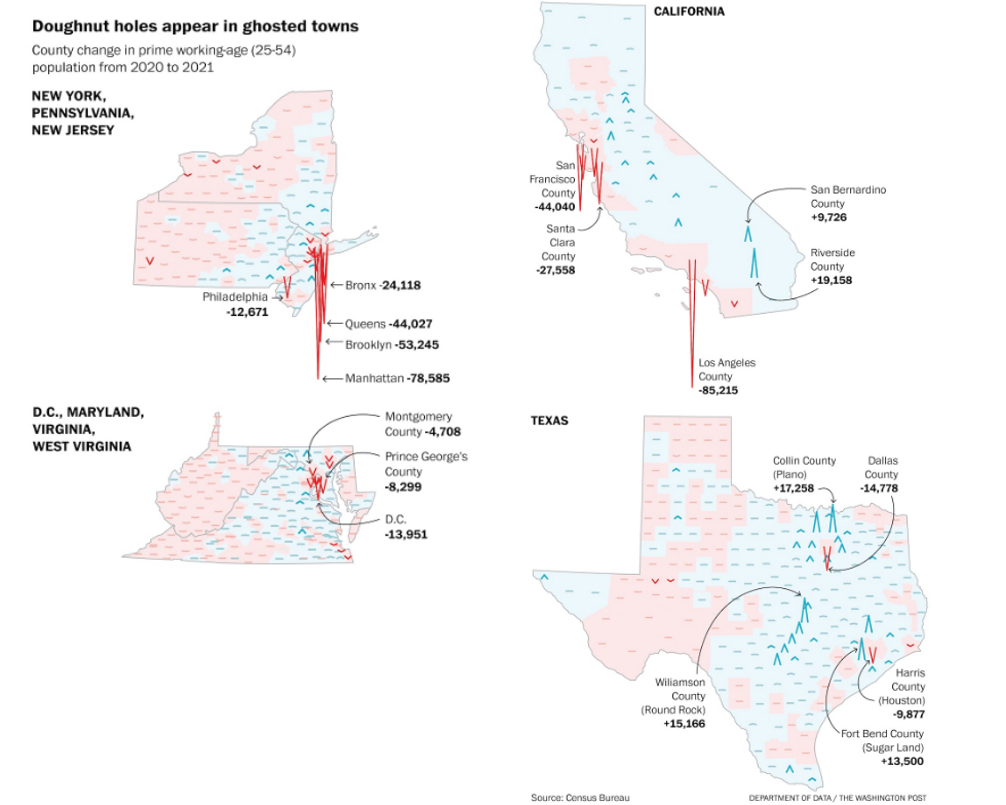
The largest cities in America had pretty large exoduses, leaving to work from small metro areas, exurbs, and more rural places as well. In counties with cities like New York, LA, Chicago, and San Francisco, we see pretty sizable drops that stand out compared with the rest of the country.
In the map I shared last week, I talked about how a choropleth map can “lie” by giving more weight/space to areas that are less populated density. In this map, that issue is being resolved by using symbology so each county has the same size (width) of their arrows; this map however is making the tradeoff by showing population counties rather than density. This dramatically highlights those larger cities, but those places had larger populations to begin with. I really like this map a lot, but think it would also have been interesting to see paired with one that also shows these losses/gains as a share of the county’s population.
As you are mapping your own data, consider the fact that in order to map the world, you have to make tradeoffs and you need to think carefully about what you want to show and what you’re giving up.
Happy plotting!