SI Standard Style with ggplot
2020-04-24 Baboyma Kagniniwa
vignette ggplot vizualisation
How to create standard visualizations across SI team with USAID’s alternate fonts, Sans Source Pro.
This font is not only not native to R, nor is it a standard to Windows.
glitr
glitr is SI graphics package to adorn your plots with ggplot
Installation
glitr is not on CRAN, so you will have to install it directly from Github using devtools.
Follow the installation guide from the github repo
Make sure install Sans Source Pro font as well
Use cases
- Load required R Packages
library(tidyverse)
library(glitr)
- Make sure iris sample data is loaded
iris %>%
  glimpse()
iris %>% head()
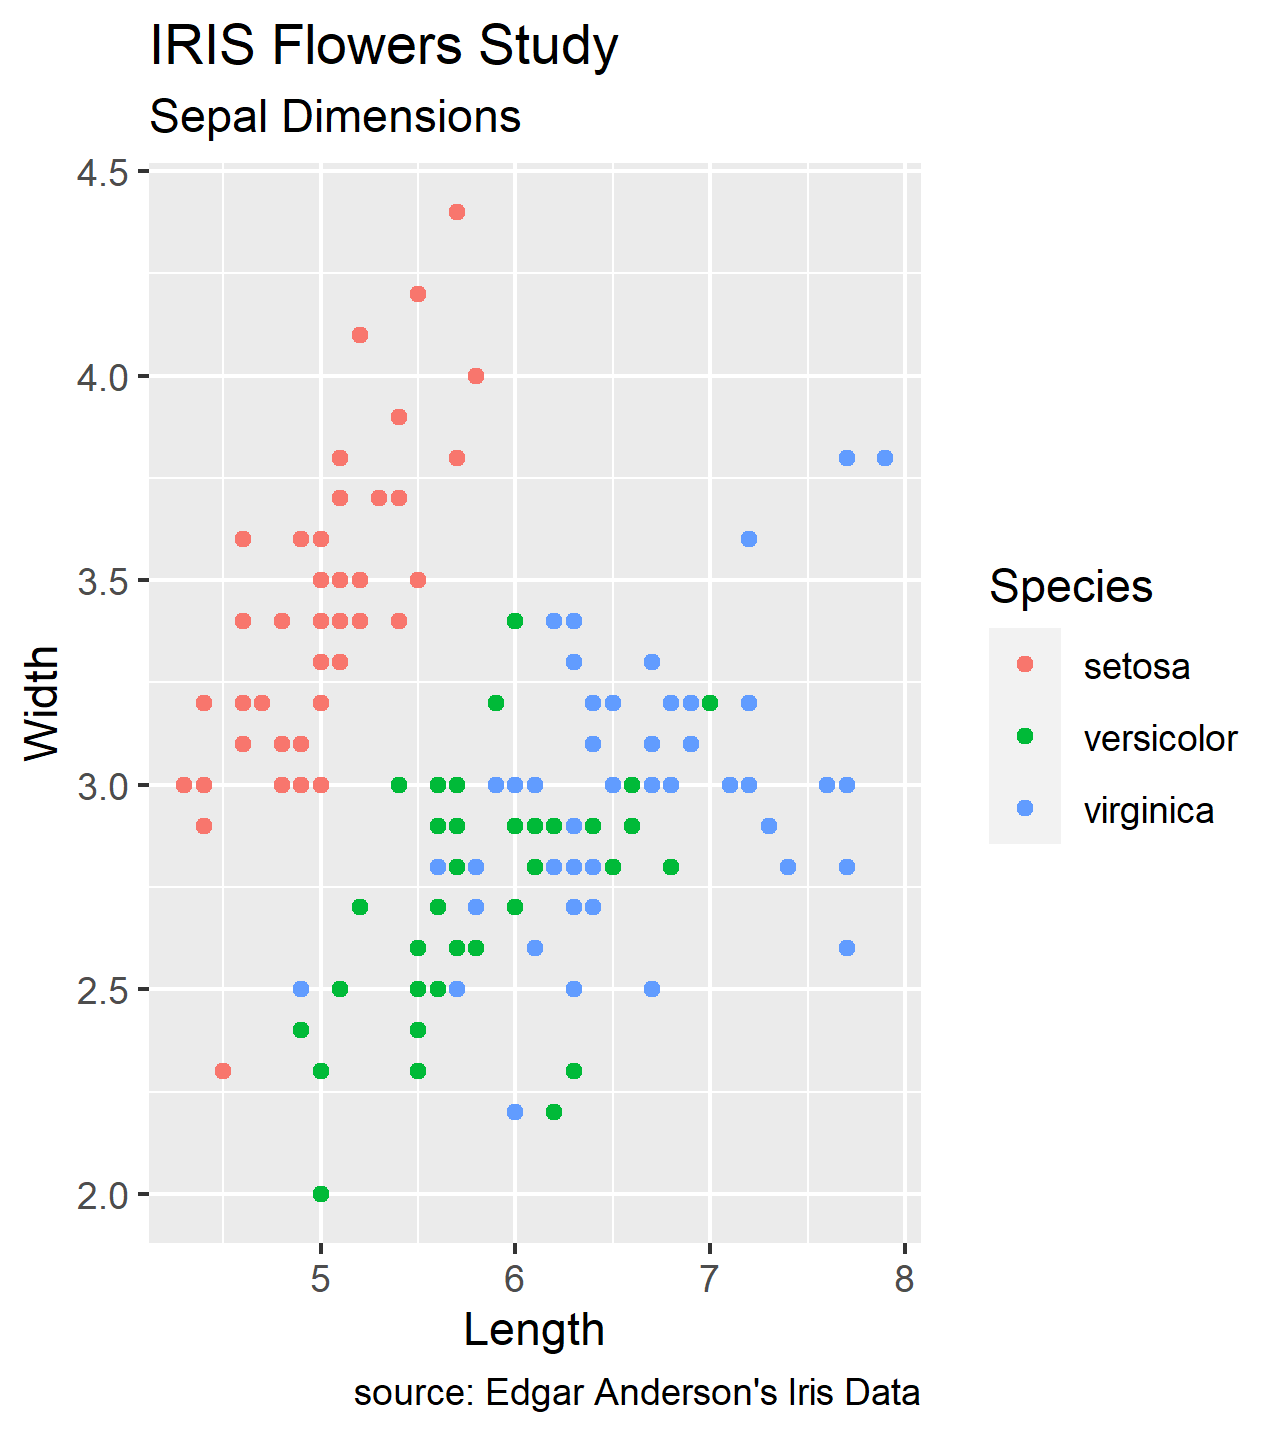
- Create a scatter plot with with default ggplot options
iris %>%
  ggplot(aes(Sepal.Length, y = Sepal.Width, colour = Species)) +
  geom_point() +
  labs(x="Length", y="Width",
      title = "IRIS Flowers Study",
      subtitle = "Sepal Dimensions",
      caption = "source: Edgar Anderson's Iris Data")

ggsave("assets/img/tutorials/iris_scatter_plot_default.png")
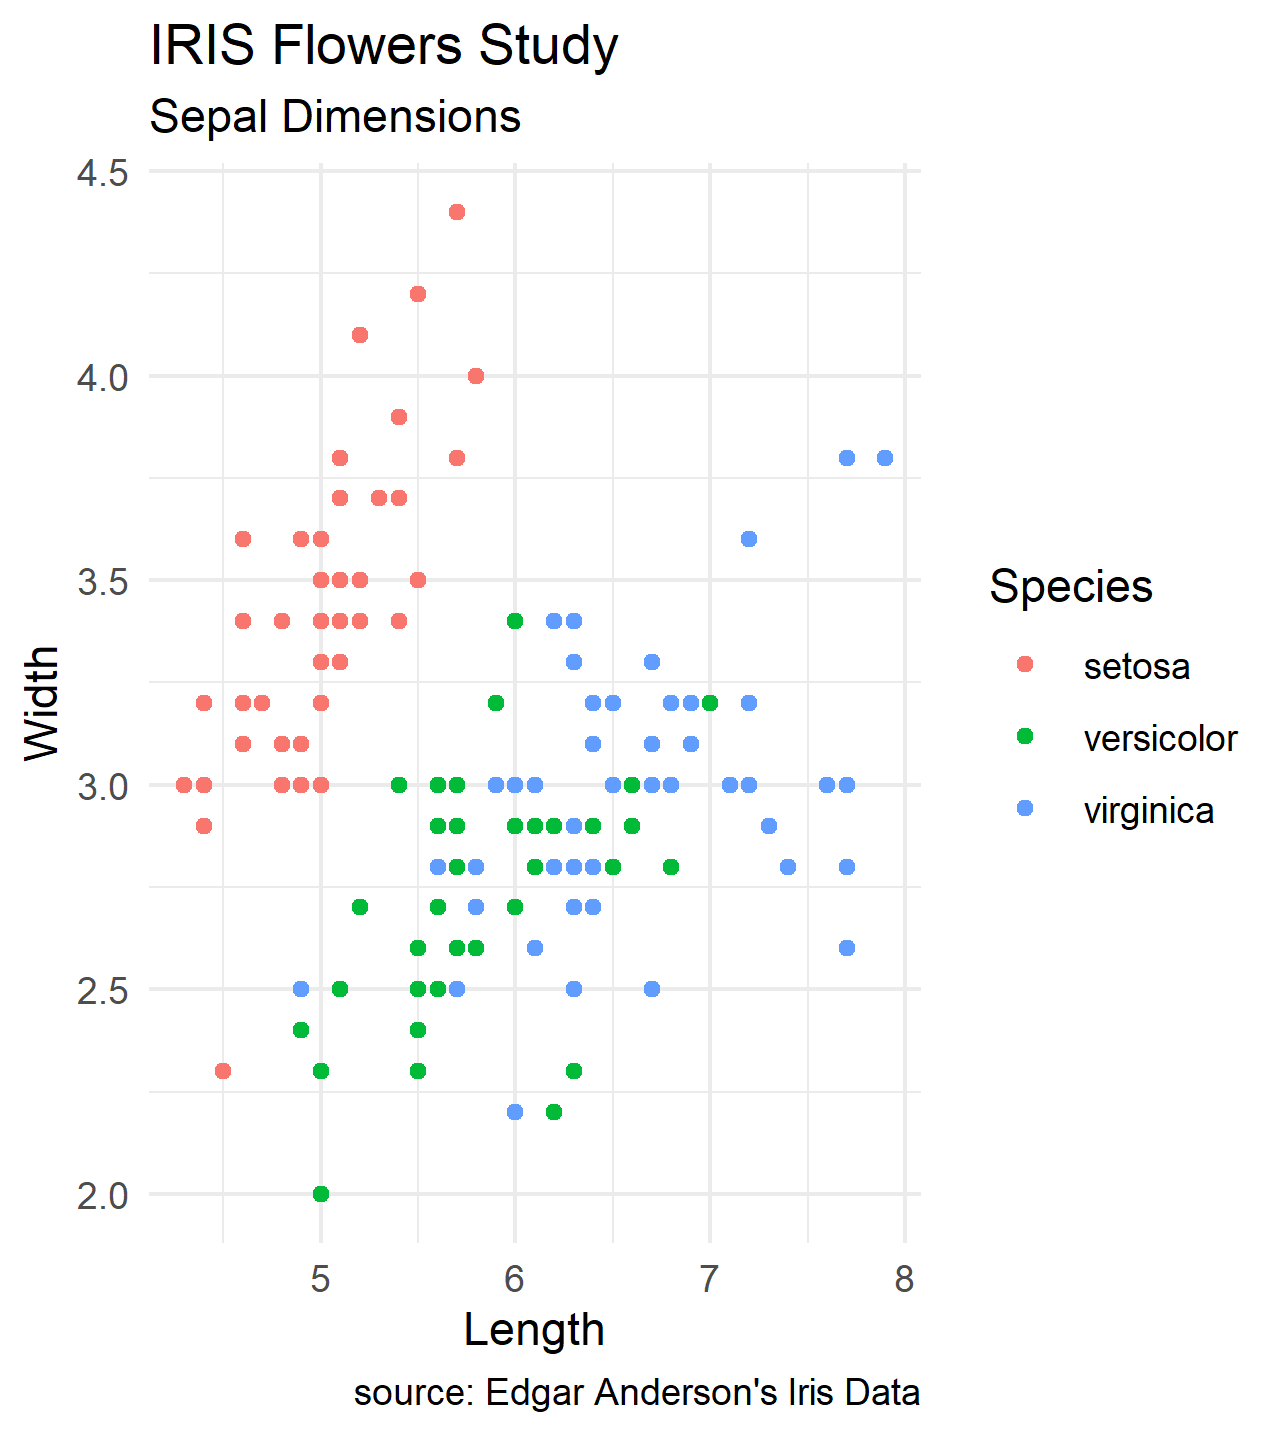
- Create a scatter plot with with ggplot minimal theme
iris %>%
  ggplot(aes(Sepal.Length, y = Sepal.Width, colour = Species)) +
  geom_point() +
  labs(x="Length", y="Width",
      title = "IRIS Flowers Study",
      subtitle = "Sepal Dimensions",
      caption = "source: Edgar Anderson's Iris Data") +
  theme_minimal()

ggsave("assets/img/tutorials/iris_scatter_plot_minimal.png")
- Create a scatter plot with with SI Strandard Styles
si_style() function extends ggplot minimal theme along with a re-adjustement of the plot title, subtitle and capture.
iris %>%
  ggplot(aes(Sepal.Length, y = Sepal.Width, colour = Species)) +
  geom_point() +
  labs(x="Length", y="Width",
      title = "IRIS Flowers Study",
      subtitle = "Sepal Dimensions",
      caption = "source: Edgar Anderson's Iris Data") +
  si_style()

ggsave("assets/img/tutorials/iris_scatter_plot_si_style.png")

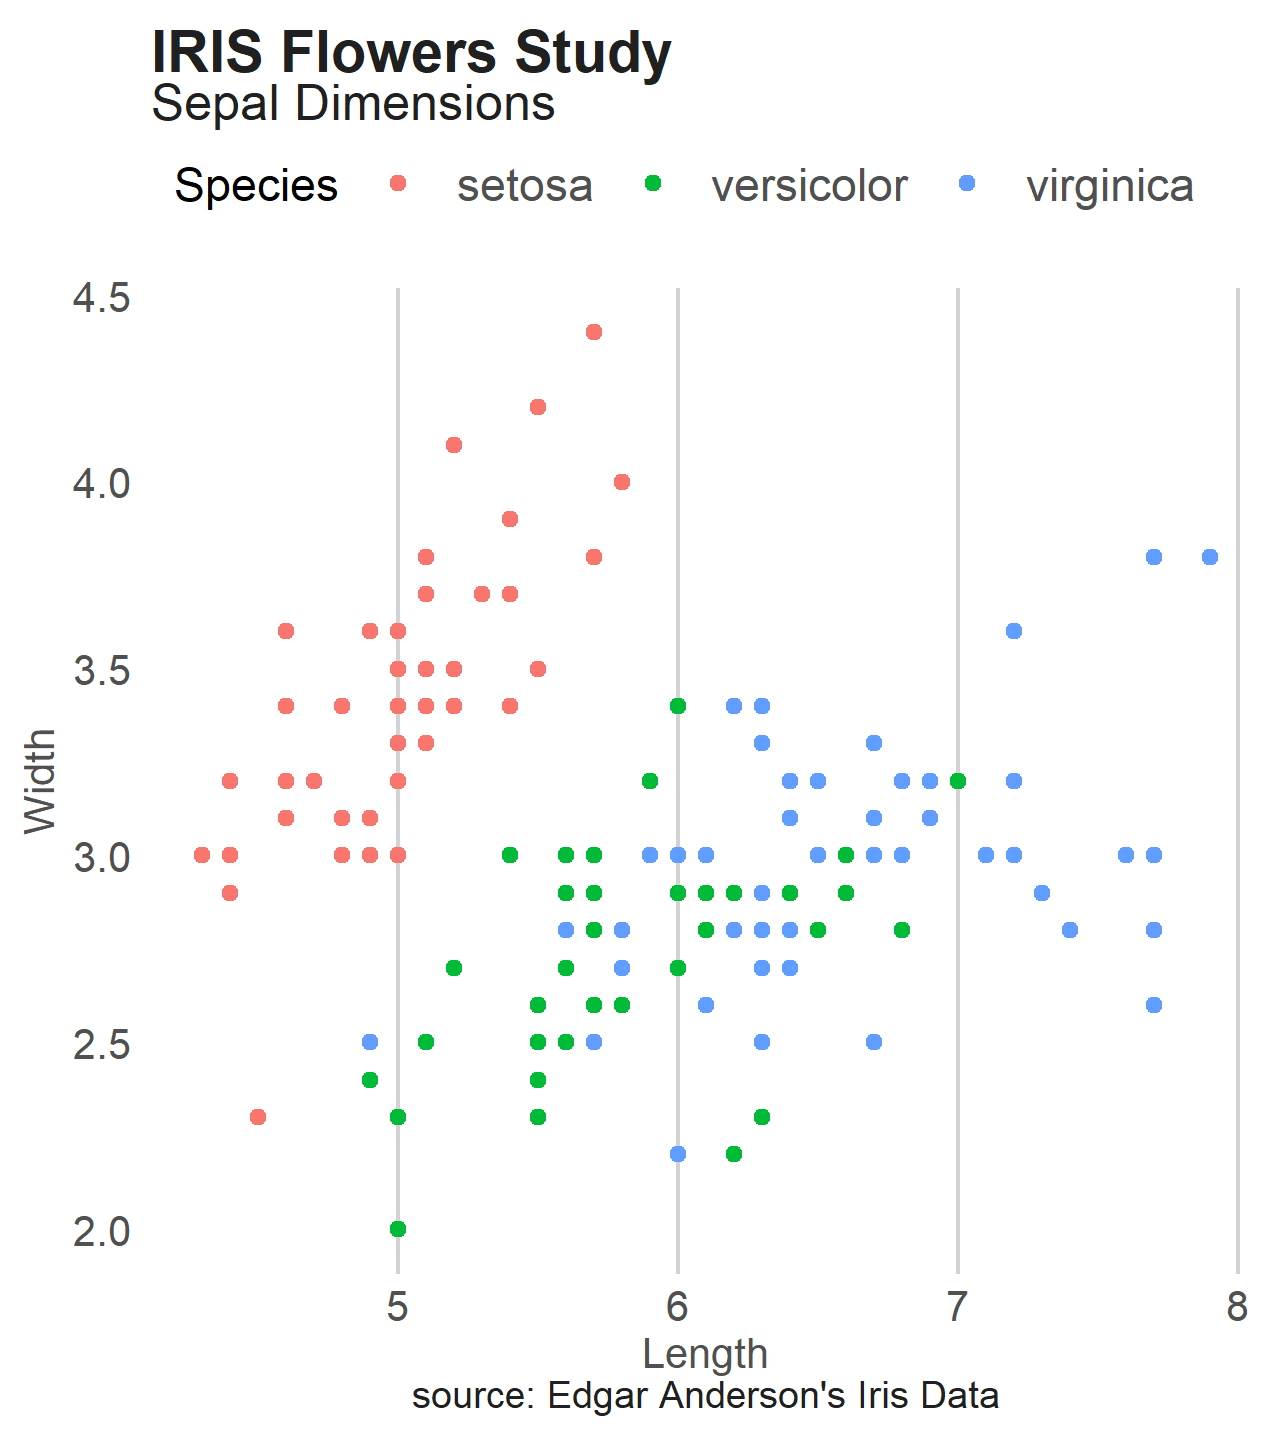
si_style_xgrid displays only the x axes
iris %>%
  ggplot(aes(Sepal.Length, y = Sepal.Width, colour = Species)) +
  geom_point() +
  labs(x="Length", y="Width",
      title = "IRIS Flowers Study",
      subtitle = "Sepal Dimensions",
      caption = "source: Edgar Anderson's Iris Data") +
  si_style_xgrid()

ggsave("assets/img/tutorials/iris_scatter_plot_si_style_xgrid.png")
si_style_ygrid displays only the y axes
iris %>%
  ggplot(aes(Sepal.Length, y = Sepal.Width, colour = Species)) +
  geom_point() +
  labs(x="Length", y="Width",
      title = "IRIS Flowers Study",
      subtitle = "Sepal Dimensions",
      caption = "source: Edgar Anderson's Iris Data") +
  si_style_ygrid()

ggsave("assets/img/tutorials/iris_scatter_plot_si_style_ygrid.png")

si_style_xline displays only the x line
iris %>%
  ggplot(aes(Sepal.Length, y = Sepal.Width, colour = Species)) +
  geom_point() +
  labs(x="Length", y="Width",
      title = "IRIS Flowers Study",
      subtitle = "Sepal Dimensions",
      caption = "source: Edgar Anderson's Iris Data") +
  si_style_xline()

ggsave("assets/img/tutorials/iris_scatter_plot_si_style_xline.png")

si_style_yline displays only the y line
iris %>%
  ggplot(aes(Sepal.Length, y = Sepal.Width, colour = Species)) +
  geom_point() +
  labs(x="Length", y="Width",
      title = "IRIS Flowers Study",
      subtitle = "Sepal Dimensions",
      caption = "source: Edgar Anderson's Iris Data") +
  si_style_yline()

ggsave("assets/img/tutorials/iris_scatter_plot_si_style_yline.png")
si_style_xyline displays only the x and y lines
iris %>%
  ggplot(aes(Sepal.Length, y = Sepal.Width, colour = Species)) +
  geom_point() +
  labs(x="Length", y="Width",
      title = "IRIS Flowers Study",
      subtitle = "Sepal Dimensions",
      caption = "source: Edgar Anderson's Iris Data") +
  si_style_xyline()

ggsave("assets/img/tutorials/iris_scatter_plot_si_style_xyline.png")

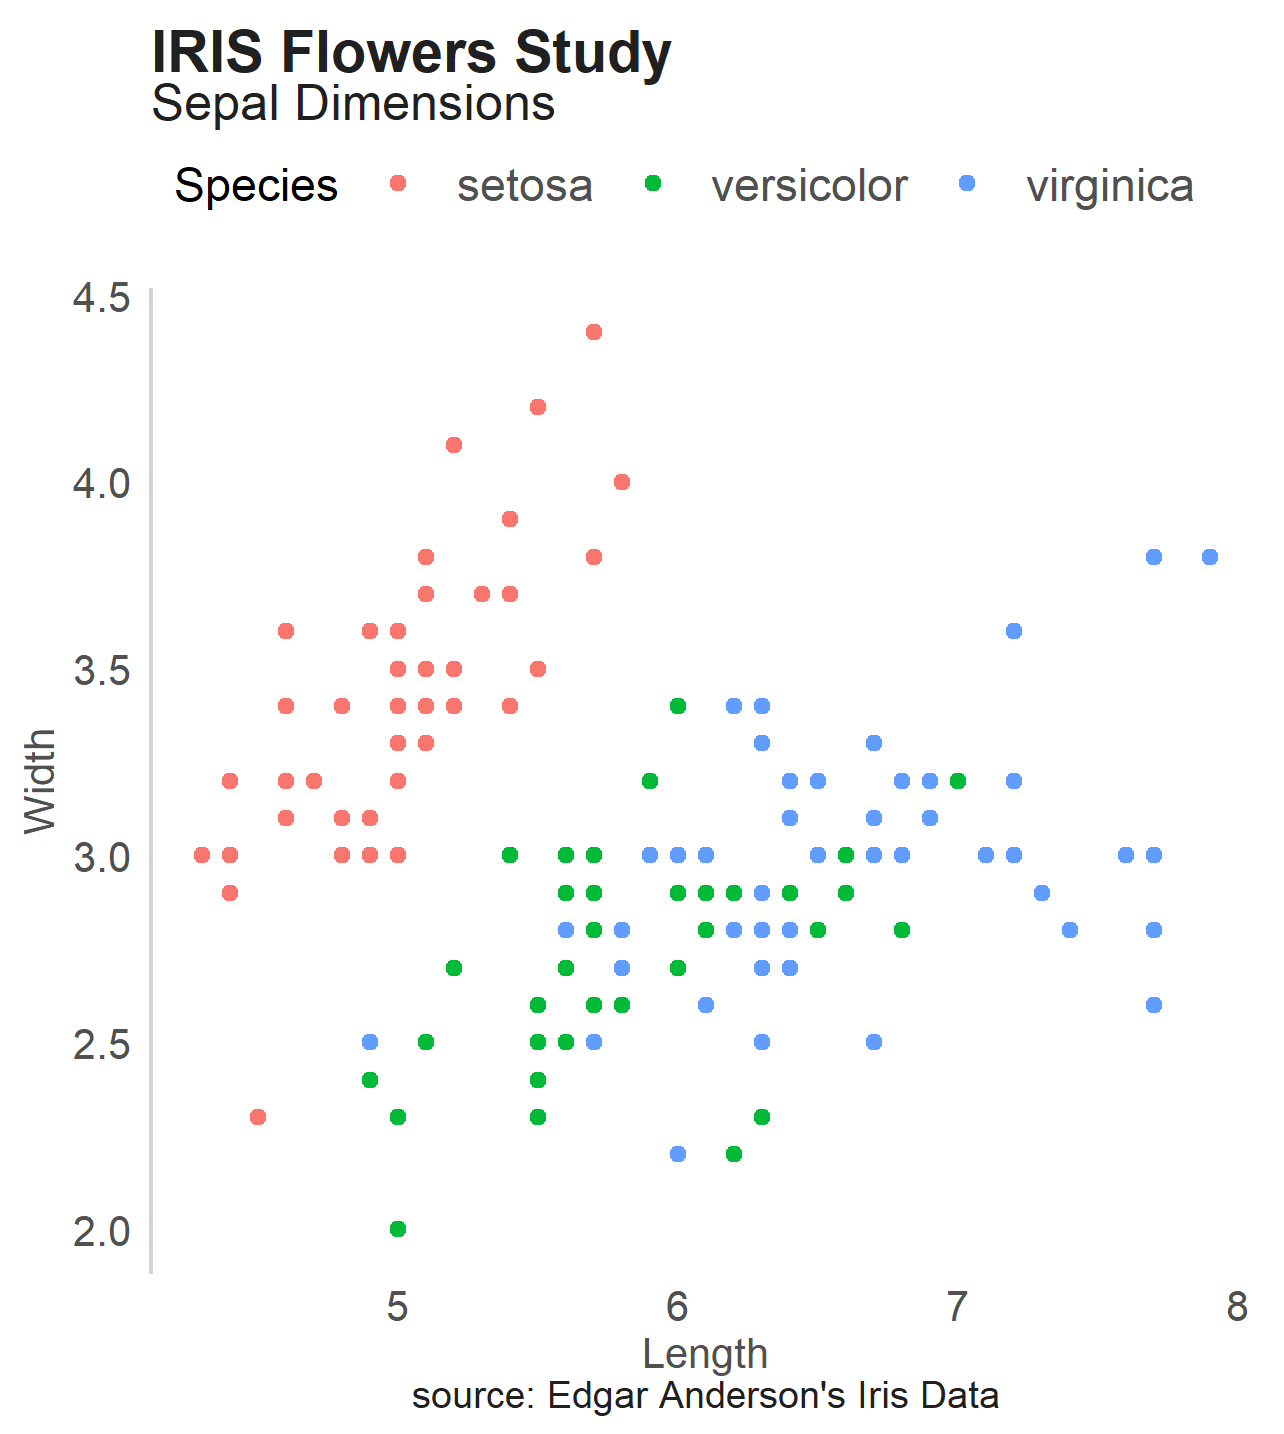
si_style_nolines displays only the no lines
iris %>%
  ggplot(aes(Sepal.Length, y = Sepal.Width, colour = Species)) +
  geom_point() +
  labs(x="Length", y="Width",
      title = "IRIS Flowers Study",
      subtitle = "Sepal Dimensions",
      caption = "source: Edgar Anderson's Iris Data") +
  si_style_nolines()

ggsave("assets/img/tutorials/iris_scatter_plot_si_style_nolines.png")

Note: These SI Styles are still under construction and all feedback / comments are welcome.