Monday Data Viz - Hiking Inspiration
2021-09-20 Aaron Chafetz
data-viz vizualisation monday-data-viz
Inspiration comes in all shapes and sizes. Last week, I was really drawn to one of Tableau’s Data Viz of the Day - Mountain Hikes, by Agata Kettrick.
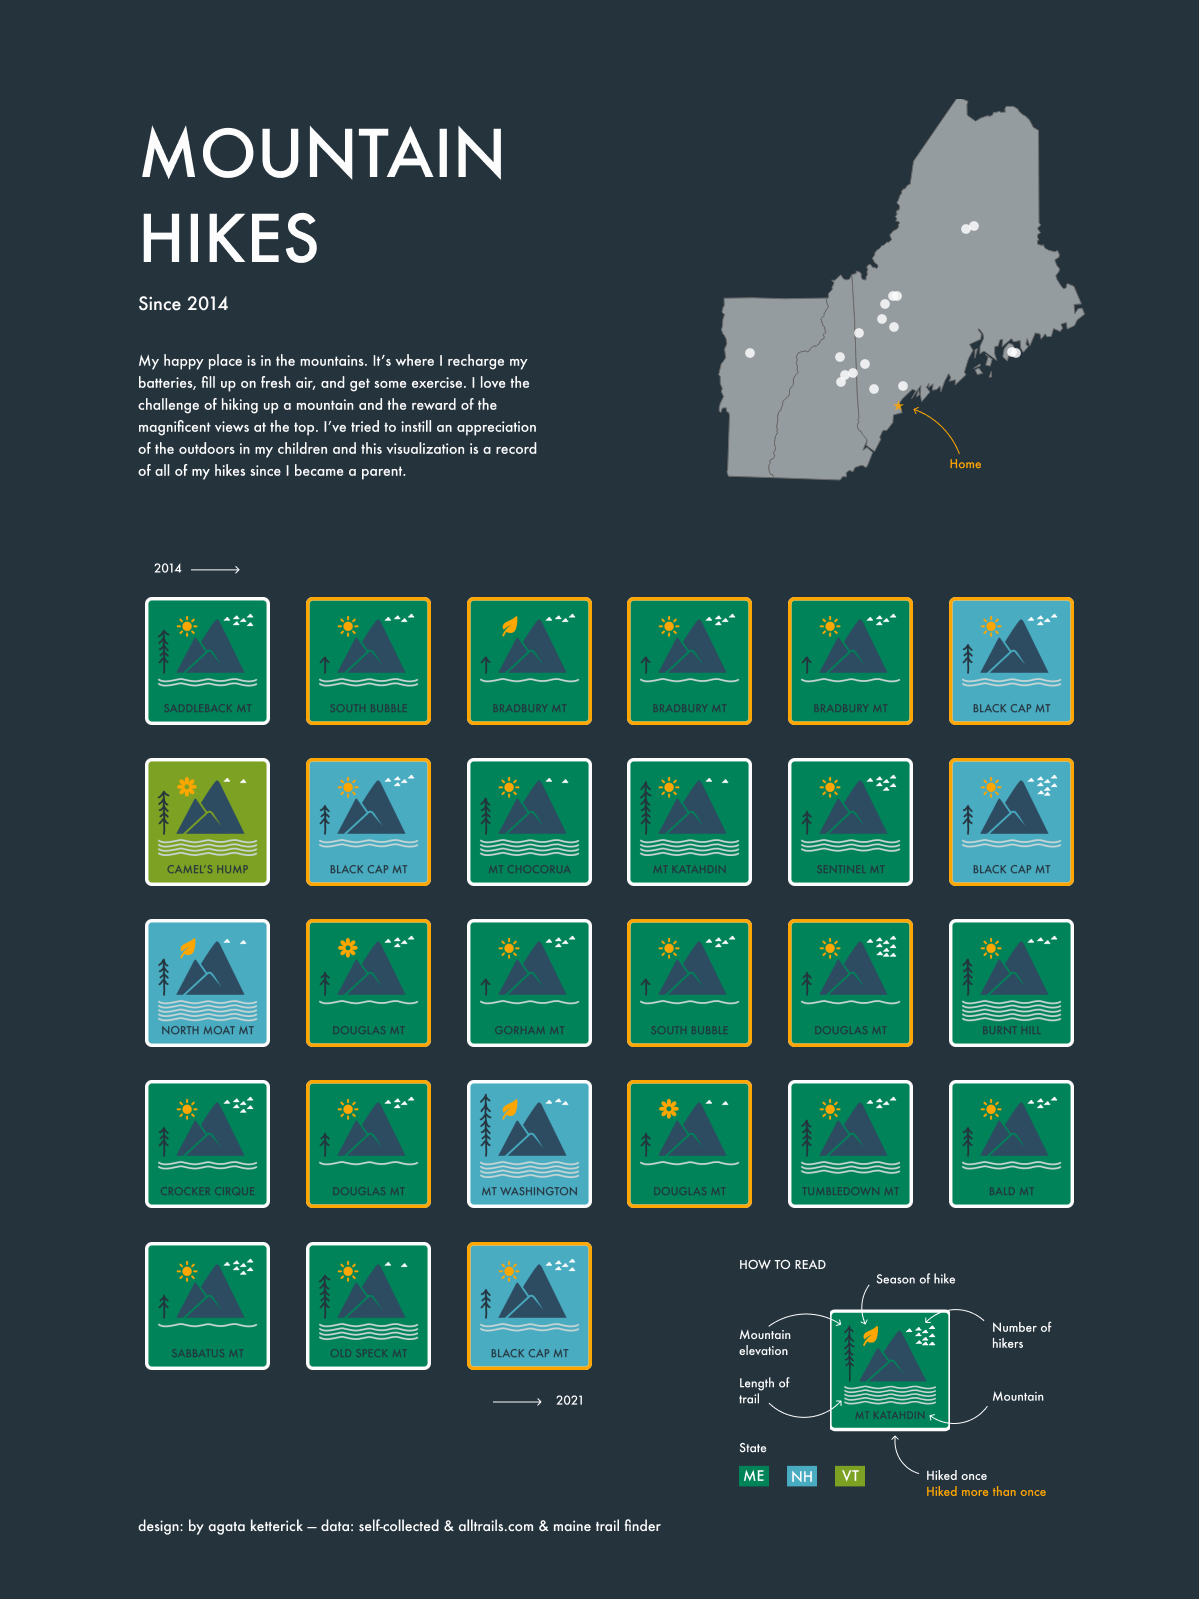
First off, the colors are used super well. But what I really liked about this piece was the author’s ability to encode data in some great, thematic ways beyond the standards we’re used to. Take a look at the great legend in the lower right hand corner.
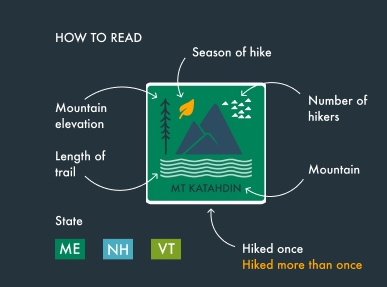
Ketterick uses seven (!) different data encodings - five through icons and two through color - that work seamlessly with the overall theme and don’t overwhelm the reader. This sort of visualization isn’t going to be heavily prevalent in our work since it’s more art and less useful for making quick comparisons and insights from, but I think it’s both a fun and inspirational data viz piece that I kept going back to all week.
Happy plotting!