Monday Data Viz - Timelines and Icons
2022-11-28 Aaron Chafetz
data-viz vizualisation monday-data-viz
More World Cup content from me this week. There have been lots of great games in the group stage to watch since the World Cup began last Sunday. I was reviewing some of the games’ summaries on ESPN’s site and came across a pretty good graphic of theirs - a game timeline with effective and simple icons.
Here is an example from the big Saudi Arabia upset of Argentina last Tuesday. The graphic spans the 90 minutes of the game (plus stoppage time). Each major event is noted on this timeline with the minute of the game it occurred in and the event type noted by a useful and easy to read symbol, which is placed above or below the timeline based on the team.
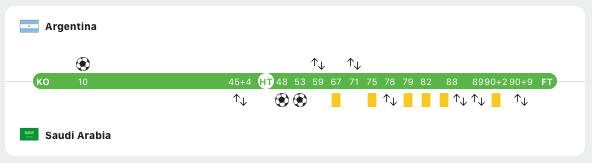
From the graphic, we can see that Argentina scored rather quickly (off a penalty kick by super star Lionel Messi) and then not too much else occurred the rest of the first half other than a substitution during stoppage time. Then things heated up in the second half with two quick goals and then lots of intense playing, noted by the six yellow cards Saudi Arabia received.
These visuals provide a lot more context of what occurred in the game (and when) than if you just looked at the final score, or even the box score which just noted in a list of who scored when. It’s easy to quickly scan the timeline due to the use of simple, but effective icons.
Happy plotting!