Monday Data Viz - Be wary of chloropleth maps
2021-01-11 Aaron Chafetz
data-viz vizualisation monday-data-viz
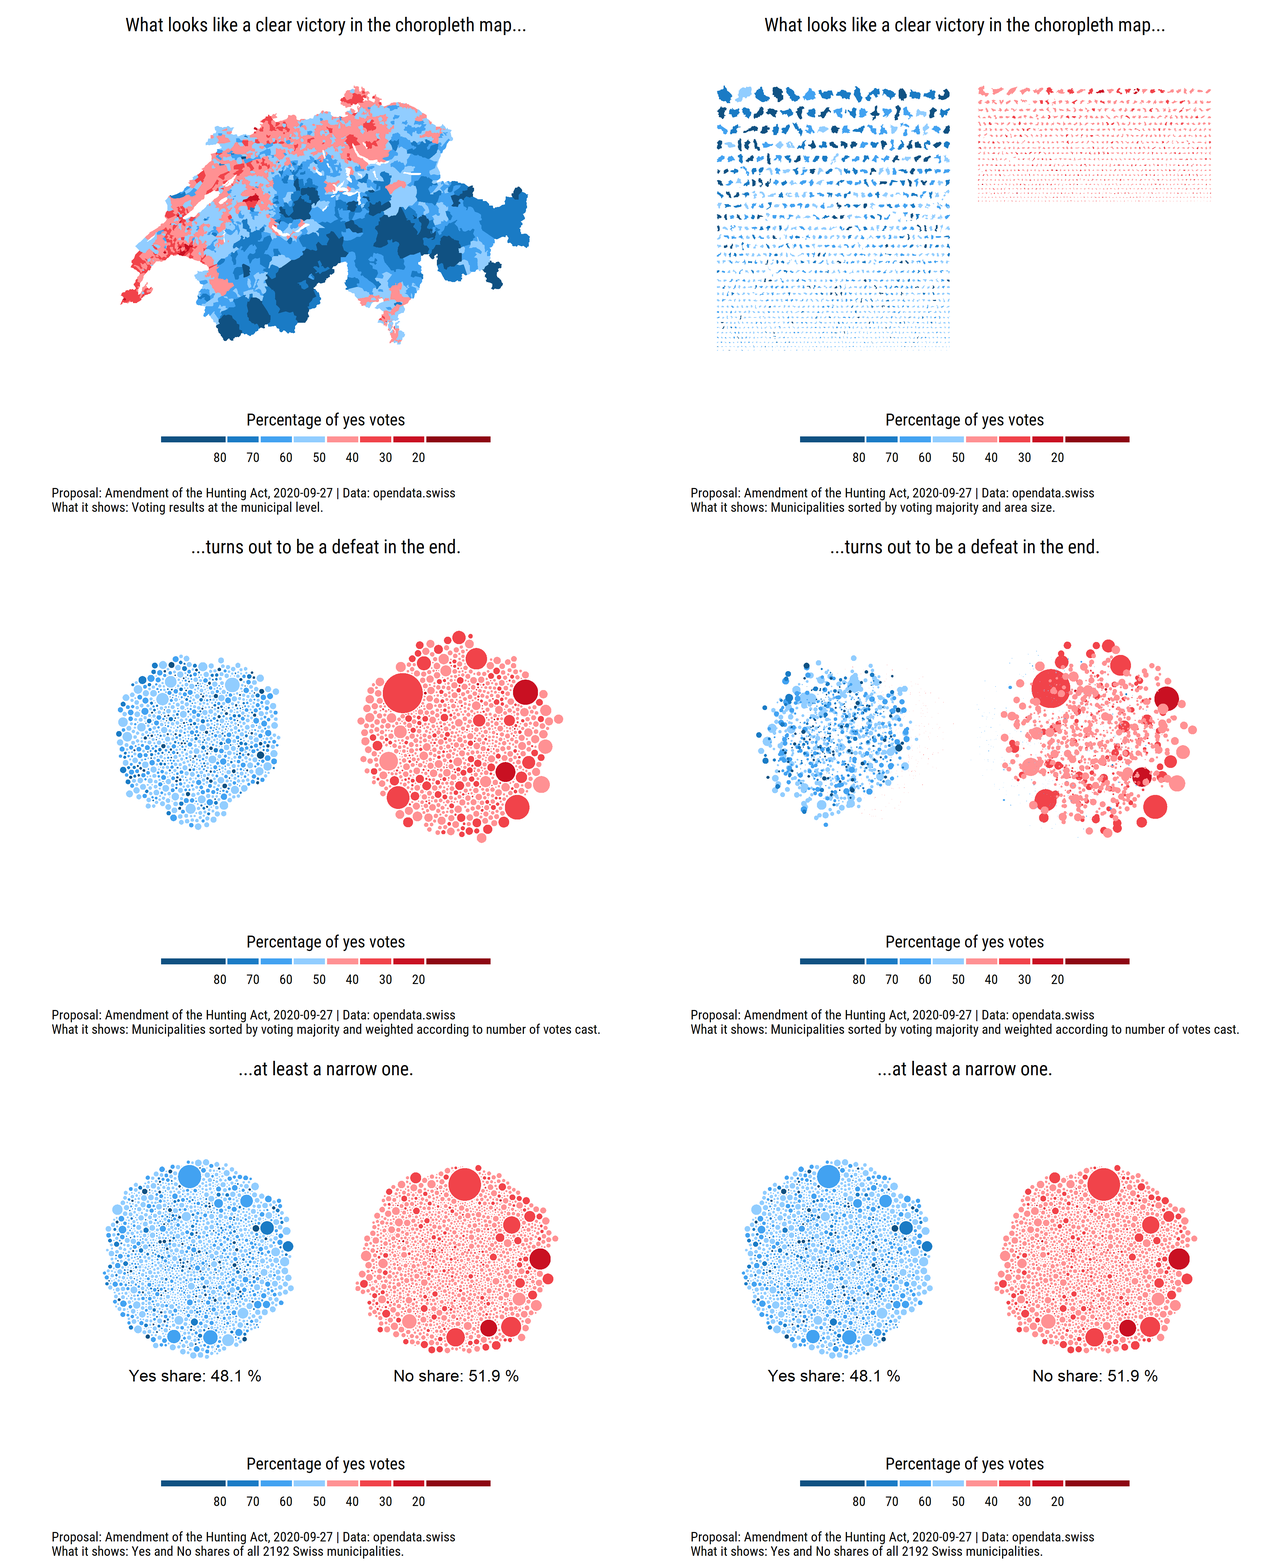
To kick off the year, I wanted to share a nifty gif on twitter the other week. This gif is a take on the “land doesn’t vote, people do” visual from 2019 depicting the US.

The fist image in the new gif is a map of Switzerland showing the results of votes for the Hunting Act Amendment in Sept 2020. The choropleth map shows votes by municipality, appearing that the act passed by a large majority. But, “land doesn’t vote, people do”; land area isn’t representative of how many people live there. The amendment in fact didn’t pass.
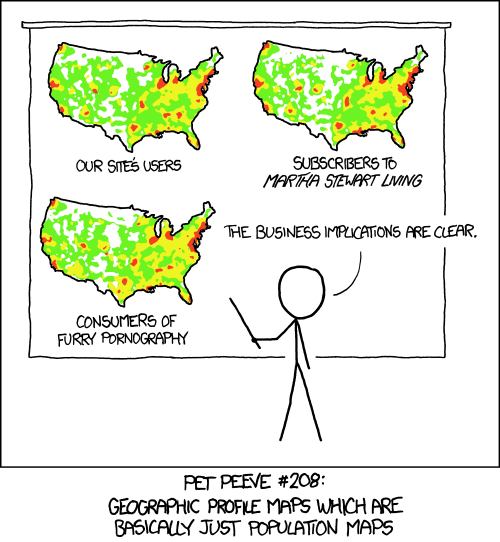
As expressed by one of my favorite xkcd comics, it’s easy to “lie” or misinterpret maps when you don’t account for the underlying population.

As you map out treatment or testing by districts in a country, make sure you don’t fall into this trap without understanding (or trying to incorporate) the denominator - PLHIV or population.